DOI Nr.: https://doi.org/10.25929/y4b9-e908
Peter Faber
Technische Hochschule Deggendorf
Tanja Maier
Technische Hochschule Deggendorf
Stefan Schuster
Technische Hochschule Deggendorf
ABSTRACT
Today, maintainability is of great importance for software projects. In this regard, software metrics play a crucial role in software development: these metrics may be used to objectively assess certain aspects of the software project at hand. We give an overview of available software metrics and evaluate their availability in software development tools. To that end, we explore their usage for the improvement of an Android app project – the E-WALD InCarApp. We provide evidence about their usefulness in a case study by measuring and comparing different aspects of the software project, leading to a derived software metric. We focus especially on measuring and improving code quality and compare these results to statements obtained from developer interviews which indicate that our derived metric may well be used to identify hot-spots for optimization.
Wartbarkeit ist heutzutage von größter Wichtigkeit für Software-Projekte. Hierzu spielen Software-Metriken eine zentrale Rolle in der Software-Entwicklung: Diese Metriken können genutzt werden, um gewisse Aspekte des betrachteten Software-Projekts objektiv einzuordnen. Wir geben eine Übersicht über zur Verfügung stehende Software-Metriken und evaluieren ihre Verfügbarkeit in Software-Entwicklungs-Tools. Dazu betrachten wir ihre Anwendung bei der Verbesserung eines Android-App-Projekts – der E-WALD InCarApp. Wir weisen ihre Nutzbarkeit in einer Fallstudie nach, in der wir unterschiedliche Aspekte des Software-Projekts messen und vergleichen, was uns zu einer abgeleiteten Software-Metrik führt. Wir konzentrieren uns hier vor allem auf die Messung und Verbesserung der Code-Qualität insbesondere der Wartbarkeit und vergleichen die Resultate mit Aussagen aus Interviews mit den Software-Entwicklern. Die einfache abgeleitete Metrik erscheint dabei durchaus schon geeignet, um Hot-Spots für Optimierungspotenziale zu identifizieren.
KEYWORDS
Java, Android, app programming, software engineering, software metrics
Java, Android, App-Programmierung, Software-Engineering, Software-Metriken
1. Introduction
Software development is a fast-paced process building systems in a world with constantly changing requirements. As a consequence, software source code evolves over time becoming more and more complex and thus harder to understand and maintain. To quantify this notion of complexity, many software metrics have been introduced and are available in different tools. These metrics can be used at different stages in the software development process, and each metric tends to show specific advantages and shortcomings. One could demand, for instance, that source files have to be short in order to be quickly understood and thus maintained. Such a demand could then be supported by counting the lines of code of all source files – this is the value the so-called Lines of Code metric (LOC) provides. However, even a short source file can be hard to modify if hundreds of classes depend upon this very file and one therefore also needs instruments measuring the degree of dependency.
Therefore, this work compares a range of popular code metrics and evaluates their fitness for refactoring purposes – in this case of the E-WALD Android InCarApp, an advanced driver assistance system for electric vehicles (EV). The selection of tools used for calculating metrics was therefore governed by their ability to process Android Java code. This article provides
- an introduction to the theory behind some of the more popular code metrics and gives an overview of the available tools to compute these metrics in Section 2.
- a case study describing the use of several metrics in the development process of the E-WALD InCarApp in Section 3. In particular, we provide measurements of different versions of the app and compare them.
- an evaluation of our case study and a discussion of how well the code metrics mirror the actual refactoring decisions in Section 4
- a conclusion and ideas for future work in Section 5.
2. Measuring Code Quality
Loosely following Ebert [1], most code metrics can be subsumed in one of the following categories:
* Volume-based metrics
* Encapsulation-based metrics
* Structure-based metrics
Let us first review the properties of these metrics following the above classification.
2.1 Volume-based Metrics
Volume-based metrics simply mirror the amount of code used for a given task -- just as the LOC metric mentioned in Section 1.
Number of Public Methods (NPM). Counts the number of public (and thus externally callable) methods of a class [2]. We use the tool ckjm [3] (see below) for measuring NPM.
Non-commented Source Statements (NCSS). Even though LOC is easy to compute, the lines that actually make up all the complexity of the code are only the executable source statements; thus, comments an empty lines should be ignored when comparing source codes [4]. NCSS only counts these executable source statements. This makes the metric harder to compute, since tools actually have to parse the code under consideration. Moreover, there is no common definition of „executable statement“. As an example, the Teamscale tool by Heinemann et al. [5] considers Java import statements as source code, while Tim Littlefair‘s CCCC [6] does not. This emphasizes that there is usually not a single absolute number that can be assigned to some piece of code even for simple metrics. We used the Teamscale tool to measure the NCSS metric.
Weighted Methods per Class (WMC). This metric, introduced by Chidamber and Kemerer [7], assigns a weight to each method of a class and sums up those weights. This gives a rough estimate of the complexity of the class. By adjusting, the weights, can be adapted to specific situations. The most common weights are:
1. simply assign 1 to each function (counting the number of functions)
2. compute McCabe‘s cyclomatic complexity for each function (see below).
WMC -- along with a whole set of additional metrics -- can be computed using the open source command line tool ckjm [3] (which uses weight 1) or SourceMeter [8] (which uses McCabe‘s cyclomatic complexity). We use ckjm for our measurements, since we view McCabe‘s complexity separately.
McCabe‘s Cyclomatic Complexity (McCabe). The intuition behind McCabe‘s cyclomatic complexity is to measure the number of decisions in a function. To be more precise, it represents the number of independent paths (without any assumptions on decision results) through the control flow graph (CFG) of a function. The cyclomatic complexity C(G) is defined through the CFG G=(V,E) of the function [9, 10]. For a given piece of code, let V be the set of its code blocks (basic blocks). We connect two code blocks by an edge, if one code block can be directly executed after the other. Let E then be the set of those edges. Then, the cyclomatic complexity C(G) is defined by:
C(G) = |E| - |V| + 2
As an example, Figure 1 shows a CFG for the code if ( B ){ X; }. In this case, |V| = 4, |E| = 4, resulting in an overall complexity of C(G)= 4 - 4 +2 = 2, which is in fact the number of possible paths of execution. Thus, McCabe can be used to estimate the number of test cases needed for complete branch coverage. It also provides a hint towards maintainability (due to software complexity), since a code containing many complex decisions is harder to understand and thus harder to maintain than a simple one-dimensional sequence of instructions.
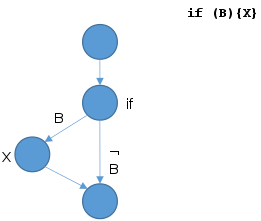
Figure 1: Example control flow graph for if ( B ){ X; }.
Tools that measure McCabe‘s cyclomatic complexity include CCCC and SourceMeter [8, 11]. Again, there are differences in the definitions applied by the tools. The most important difference here is whether short-circuiting in the programming language (i.e., evaluating a Boolean expression only as long the outcome of the expression is not yet clear, e.g. in true or [...]) is assumed to create paths in the CFG or not. For our experiments, we use SourceMeter, which models short-circuits as branches in the CFG.
(Maximum) Nesting Depth (MND), also called Nested Block Depth (NBD). The maximum nesting depth is defined as the maximum number of control statements nested into each other [12]. We measure nesting depth using the Teamscale tool.
2.2 Encapsulation-based Metrics
Object-oriented languages like Java pose a challenge for volume-based metrics:
* The methods in classes of object-oriented languages tend to be quite short and to hide decision complexity -- as the one measured by McCabe -- by calling other methods.
* Moreover, object-oriented programming itself introduces a completely different kind of complexity in programs that volume-based metrics do not handle at all: relations between classes and packages.
To tackle these problems, several new metrics have been introduced in the literature.
Coupling Between Object classes (CBO). This metric counts the number of classes that a certain class A communicates with (i.e. the number of classes B from which A calls methods or references variables) [7]. If A communicates with B on several occasions, this relation is still only counted once. Chidamber and Kemerer [7] cite 3 reasons for introducing this metric:
* A high coupling degree reduces modularity, and reuse is hindered.
* A small coupling degree promotes encapsulation and thus improves maintainability.
* Higher inter-object class coupling entails the need for more rigorous tests (and thus more complex tests).
Some authors exclude those classes B that are already in an inheritance relation with A [1]. To compute this metric, we use ckjm, which employs the original definition by Chidamber and Kemerer [7].
Afferent Couplings (CA) / Efferent Couplings (CE). Besides the mere number of coupled classes as measured by the CBO metric, one may also be interested in the strength of this coupling. Afferent (incoming) Couplings CA(A) of a class A is defined as the number of members of A that are accessed by some other class B. Correspondingly, Efferent Couplings represent the sum of all members defined in some class B that class A uses.
As an example, consider Listing 1.
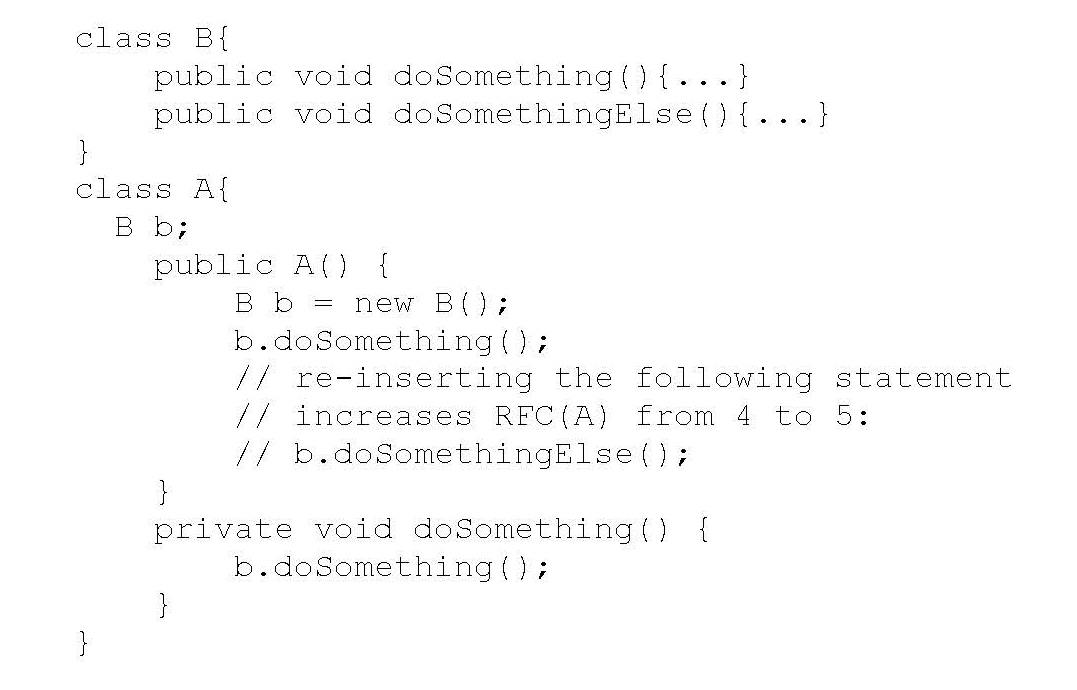
Listing 1. Example Java program: class B depends on class A via calls to doSomething() and doSomethingElse().
In the example of Listing 1, class A calls methods of class B in several places. CBO(A)=1, since only class B is referenced. Moreover, since A only calls B.doSomething() (and no additional function) CE(A)=CA(B)=1. This holds, although B.doSomething() is called twice. However, if the call to B.doSomethingElse() in A.doSomething() is re-inserted, A now calls two different functions from B, increasing CE(A)=CA(B) to 2.
Depending on application and author, the definition of CA/CE can differ, e.g. to mean the number of classes outside the current package that refer to a class inside the current package [12].
We calculate only CA and use ckjm to that end.
Response For a Class (RFC). Just as CBO, RFC was originally introduced by Chidamber and Kemerer [7]. Essentially, RFC(A) is the same as CE(A) plus the number of methods defined in A itself. Formally, RFC for a class A is defined as the number of different methods (defined in some other classes) that are called by methods of A plus the number of methods defined in A.
Reconsider the code snippet from Listing 1. In this case, RFC(A)=2+1+1=4: A contains 2 methods (the constructor B.B(), and B.doSomethingElse()), it calls 1 method from class A (A.doSomething()), and, since in Java, all objects inherit from class Object, it also calls the constructor of Object as its parent class.
Note again that, although RFC(A) does not increase any further due to the repeated call to B.doSomethingElse(), it does increase to 5, if the call to B.doSomethingElse() that is commented out is re-inserted into the code, since a different method of B is now called in addition to B.doSomethingElse().
Thus, the response for A is the number of methods that can theoretically be called when a message is sent to an object objA of type A by some other object objB (i.e. when a method of objA is called).
Again, Chidamber and Kemerer [7] cite 3 reasons for introducing this metric:
* Testing and debugging may become increasingly complex when a large number of methods has to be executed (and thus analyzed during debugging) as a response to a received message.
* Thus, RFC may be used to assess testing time.
* A large number of member methods may hint at an altogether complex class.
We measured this metric using ckjm.
2.3 Structure-based Metrics
In addition to volume-based and encapsulation-based metrics, there are further metrics that can be helpful in the analysis of source code. We subsume these metrics under the general term of structure-based metrics.
One important point – the only one we consider in this work – is the existence of clones. Clones are exact copies of code that occur at different sites from the original code. For example, the call b.doSomething() in Listing 1 occurs twice in class A -- once in the constructor and once in method A.doSomething(). Both of these occurrences are clones of each other. However, as one can plainly see, these small clones of length 1 (line) can even be desirable. However, larger sections of code that occur several times in some program code may hint at unstructured source code, because clones usually could very well be re-combined into a single function that can be called from several places. Therefore, it is important to choose a threshold that defines a lower bound for the size of a clone in order to be considered a clone. Clone detection refers to the pure indication of recurrences which can be quite helpful during coding itself. Based on the number and sizes of clones, a number can be computed to give the clone sites a meaning as a metric. This leads us to clone coverage.
Clone Coverage (CC). The canonical metric for clone recognition as described above is Clone Coverage, which is defined as the percentage of source code detected to be a clone. This can be interpreted as the probability with which some randomly picked source code is actually (part of) a clone [13]. Parameters influencing clone coverage include not only the minimal length of a clone (in LOC), but also whether variable names should be unified (or interpreted as-is) and whether generated code is to be excluded. We used the Teamscale tool to compute CC. In our analysis, clones have a minimal length of ten lines, third-party libraries were excluded (which also holds for the other metrics applied here), and variable names are subjected to a unification algorithm, i.e. clones can be recognized even after (a simple) renaming.
3. Tools
This section gives a brief overview of some tools that can be used to compute the previously defined metrics. We will describe each tool briefly and give a short assessment of the usability of the tool.
ckjm. Short for Chidamber and Kemerer Java Metrics, ckjm is a tool developed by Spinellis [3] to compute the metrics by Chidamber and Kemerer for Java programs [7]. In their paper, Chidamber and Kemerer propose seven metrics for software analysis: WMC (weighted methods per class), CBO (coupling between object classes), RFC (response for a class) plus three more metrics that we did not discuss above – DIT (depth of inheritance tree), NOC (number of children), and LCOM (lack of cohesion in methods). These metrics are computed directly as defined in the original paper by Chidamber and Kemerer [7]. In addition, Spinellis [2] included CA (afferent couplings) and NPM (number of public methods) in his tool. The tool is a stand-alone console program. The computed results are presented directly on the standard output.
ckjm computes metric values for each class separately. Anonymous classes are handled as autonomous entities. For the analysis of Java programs, ckjm relies on byte code (.class) files in JVM format. This imposes a technical problem for Android projects, where the target is Dalvik format (Dex byte code). However, Java classes are usually first compiled into JVM format before the conversion into Dex byte code. So it is possible to use the intermediate JVM byte code files (whose location depends on the IDE used) for analysis through ckjm. Also, input files have to be provided correctly on the command line. This may include additional work with UNIX tools such as find or xargs. However, several files may be combined into a single report. Still, there is no plug-in available to directly view the results during coding in an IDE.
ckjm is an open source Java program and claims to run on any Java-enabled platform.
Teamscale. The software and consulting company Continuous Quality in Software Engineering (CQSE) develops a GUI-based tool called Teamscale which is also available in an open source version called ConQAT [5, 17]. Teamscale is designed to support analysis, monitoring, optimization, and code quality engineering during software development. Teamscale shows its results in real-time.
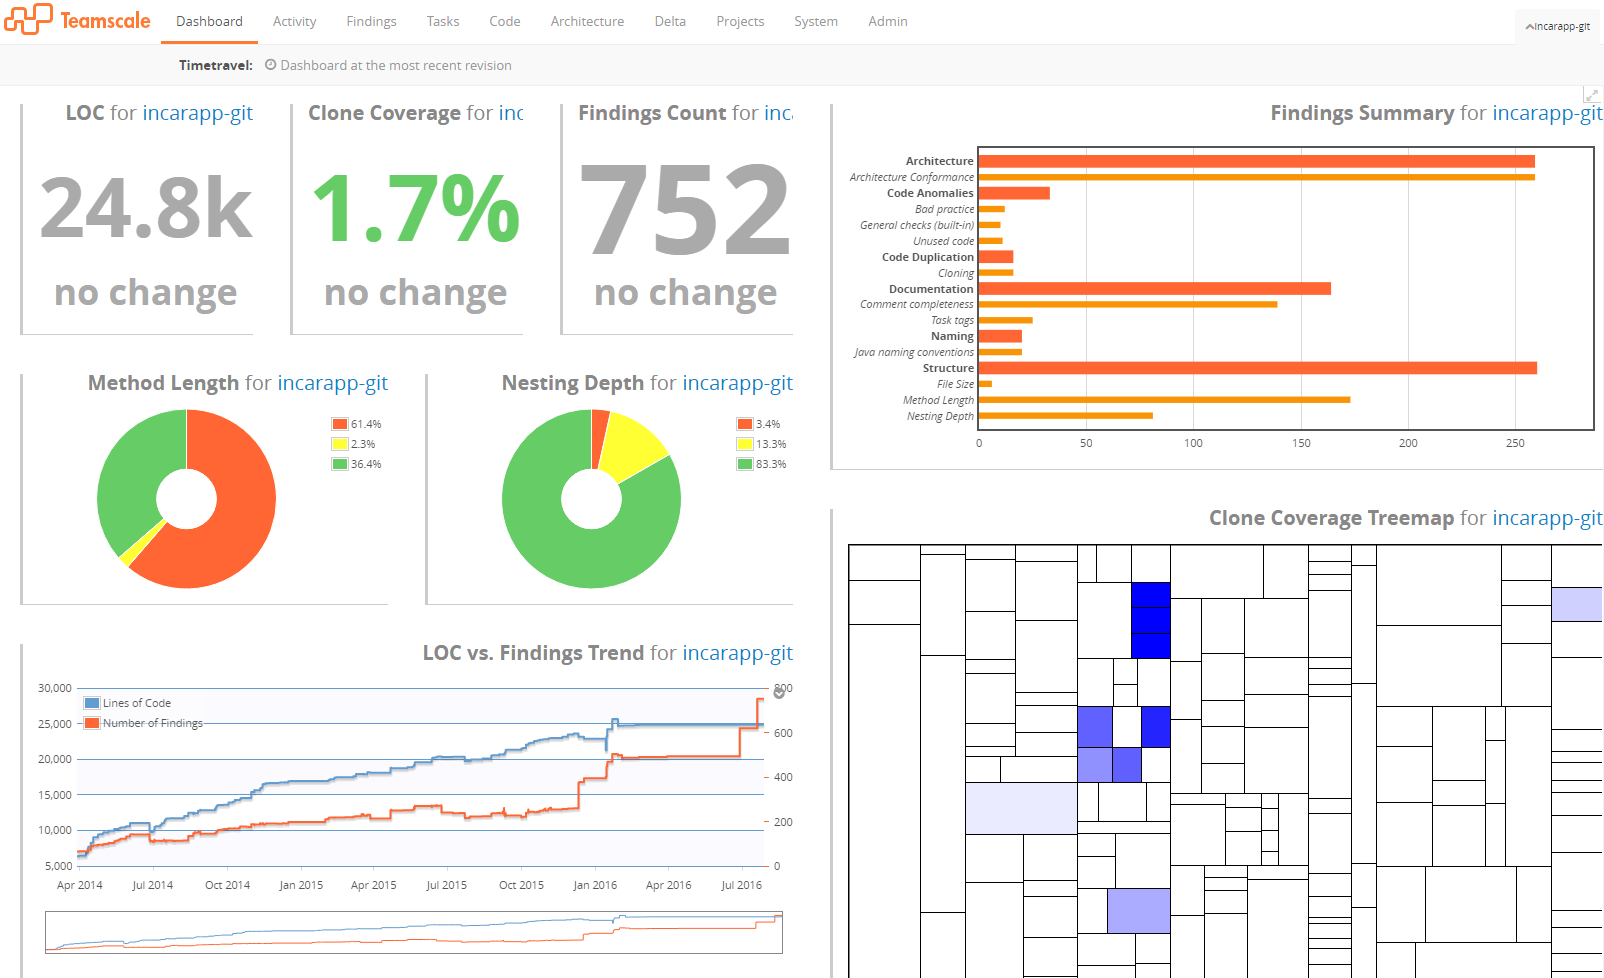
Figure 2. Dashboard of the Teamscale GUI.
The main features of the Teamscale analysis tool include analysis for architecture conformance, clone detection, test gap analysis, coding conventions, and documentation analysis.
Teamscale consists of an analyzing backend that can be run on a development computer or on a server, and a frontend that is used to represent Teamscale‘s findings graphically; the frontend can be run as a stand-alone GUI-based program or from within an IDE as plug-in (currently available for Eclipse, Visual Studio and IDEA). The most important metrics are directly visible on a configurable dashboard (cf. Figure 2).
This approach is very well suited for immediate feedback to the developer and interactive code reviews: The values observed can be represented on a time line, and the representation as a tree map directly shows very clearly where thresholds for certain metrics are exceeded in a package by applying a color code to areas of a map.
However, the tool appears suboptimal for the generation of offline reports, since the GUI partly relies on interactivity (such as the mouse hovering over interesting parts of a diagram) in order to reveal exact numbers from the analysis.
Teamscale and ConQAT are Java programs; the server component of Teamscale is available for Linux and Windows.
CCCC. CCCC is another text console-based stand-alone program. The current Ubuntu-based Linux distributions even contains a CCCC package. For each source file, it creates an XML and an HTML file that represent the results. The files are located in a hidden directory called .cccc. CCCC computes the metrics of Chidamber and Kemerer. Additionally, it computes some volume-based metrics such as LOC and McCabe. Originally, CCCC (short for C/C++ code counter) was developed for C/C++ code. CCCC claims to be also able to parse Java code, so that it can be used in the context of Android app programming.
Indeed, CCCC was able to produce output for the complete E-WALD InCarApp. However, not all Java code was treated correctly by this tool: Java annotations (such as @override) seem to confuse CCCC so much that it skips the corresponding function entirely and assigns 0-values. Since CCCC produces two output files for each input file, additional work has to be done to extract information for a common report; however, to that end, the XML files produced can be converted using UNIX tools. Thus, CCCC can be used quite well to generate offline reports using scripts; however, it does not deliver immediate feedback via IDE plug-ins.
CCCC is an open source program available for Linux, FreeBSD, and Windows.
SourceMeter. Another console-based tool is SourceMeter [8, 11], which is a program developed at FronteEndART, a company specializing in software quality management. It can be used for Java, C/C++, C#, Python, and RPG. SourceMeter is able to compute a plethora of metrics (approx. 70), e.g. McCabe, WMC, CBO, RFC, depth of inheritance tree (DIT), LOC, number of attributes (NA), and number of classes (NCL). The metric definitions here differ slightly from those employed by ckjm; e.g., as already mentioned, McCabe is used as weight for each function in WMC. SourceMeter is well-adjustable in parameters for the computed metrics (such as minimal clone length) and supports more input languages than usual.
SourceMeter is supported on Windows and Linux.
Sonargraph. Sonargraph is both, a plug-in for Eclipse/Spring or IDEA, and a GUI-based tool for analyzing Java, C#, and C++ code. It is available in two flavors -- the free Explorer version and the commercial Architect version, which includes more features. Sonargraph specializes on a specific set of metrics that we did not consider in this first study [14]. These metrics are based on class dependencies as observed by Robert C. Martin [15]; the basic idea here is that cycles in the dependency graph of classes should be avoided. However, in our preliminary tests, these kinds of dependencies occurred mainly due to the Android operating system.
Sonargraph is available for Windows, Linux, and MacOS.
Checkstyle. As an aside, this tool should be mentioned as a valuable helper for Java development; it is not directly used to measure metrics, but it can be used to guard coding standards that have been set in a project. Checkstyle, as its project homepage says, is a development tool to help programmers write Java code that adheres to a coding standard [16]. This tool can be executed as an Ant task, but also as a plug-in for Eclipse, IDEA or NetBeans. If used as a plug-in, it directly marks the occurrences of code segments that do not adhere to the defined standards. These coding standards can be adjusted by defining patterns and thresholds for these patterns. Checkstyle supplies immediate feedback to the programmer and may therefore be quite helpful in producing standard conforming code from the start.
Checkstyle is an open source stand-alone tool that can also be called via plug-ins for several IDEs including Eclipse and claims to run on Java platforms. Current Ubuntu-based Linux distributions include Checkstyle.
Summary. Table 1 shows a comparison matrix for the different tools. The first three columns show whether the corresponding tool can be used as plug-in in an IDE, in a text-console, or with a GUI. The following 6 columns show the most important supported programming languages for each tool, and the last set of columns indicates which of the more common metrics can be measured using the corresponding tool.
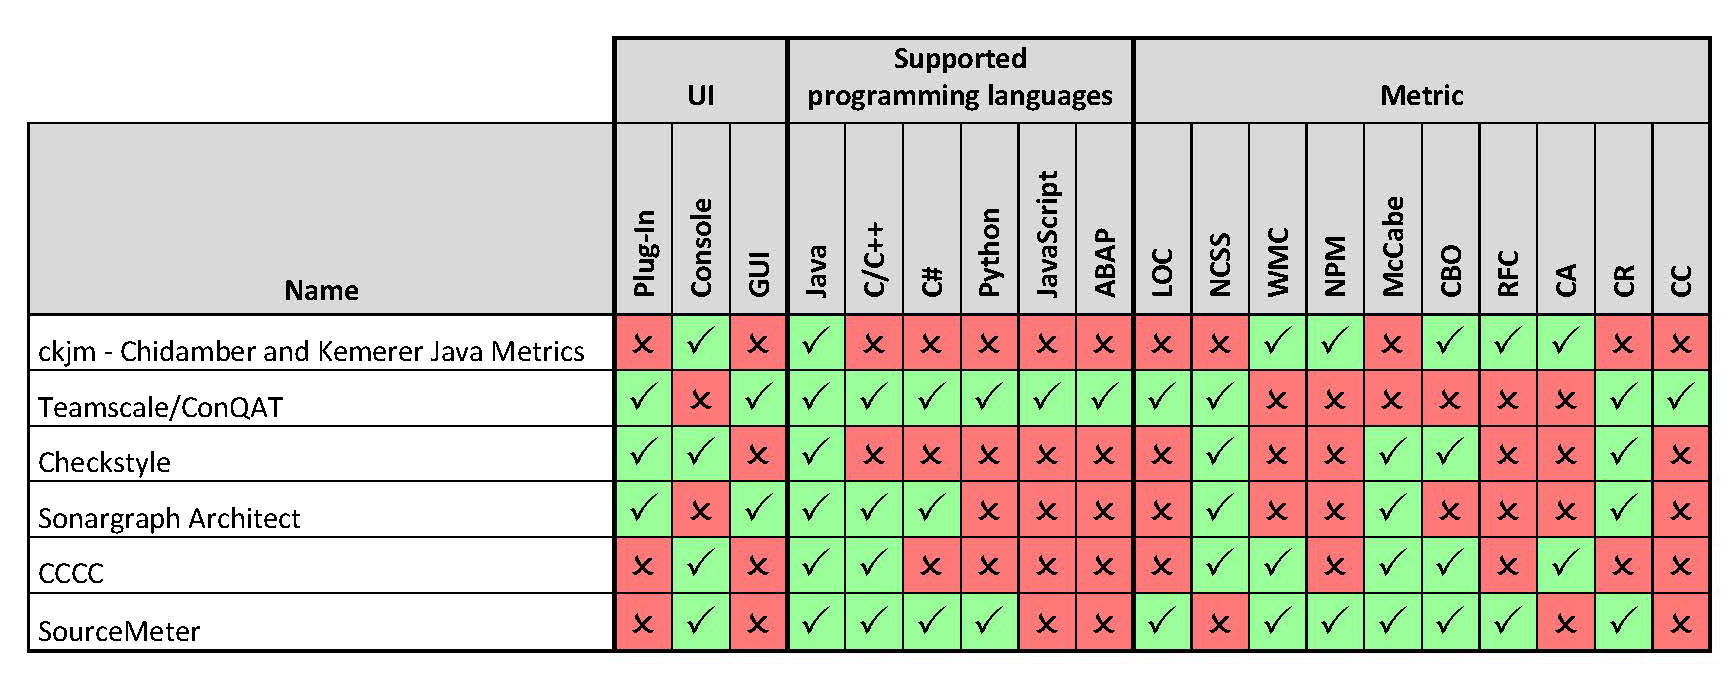
Table 1. Overview of software metrics tools and their features.
4. Evaluation
In order to evaluate the use of software metrics in the development process and assess the usefulness of the tools above, the authors followed the development process of the E-WALD InCarApp.
The E-WALD InCarApp represents a vital point in the E-WALD project whose aim is to support electric car concepts available today in rural areas. The InCarApp itself is an Android app installed on tablets inside the E-WALD electric vehicles. It is used for (1) collecting data about the current state of the car of a trip, and (2) for updating the driver about charging stations, the expected remaining range of the car on a map, and other information.
(1) Regarding the first of those aspects, the app‘s purpose can be divided into two phases that build a kind of data pipeline:
1. Collect data from
* the car‘s CAN bus (CAN: Controller Area Network; a car-internal communication network),
* GPS coordinates,
* tablet data (temperature, battery state of health etc.),
* possibly further data.
2. Provide the collected data via a central hub, e.g. for computing the remaining range of the EV.
3. Process collected data in different ways, e.g.:
* send data packets to a server for further storage and data processing
* internally process data for visual user feedback in the car
Separating these tasks from each other in the logic is of importance for the reusability of the corresponding code fragments. Thus, in order to reuse the InCarApp code in other projects, this structure should be mirrored in the class structure.
The InCarApp is in the process of transitioning from version 11 to version 12. Version 11 of the InCarApp does not clearly separate the three aspects identified, as can be gleaned from Figure 3, which shows part of the original InCarApp in a class diagram.
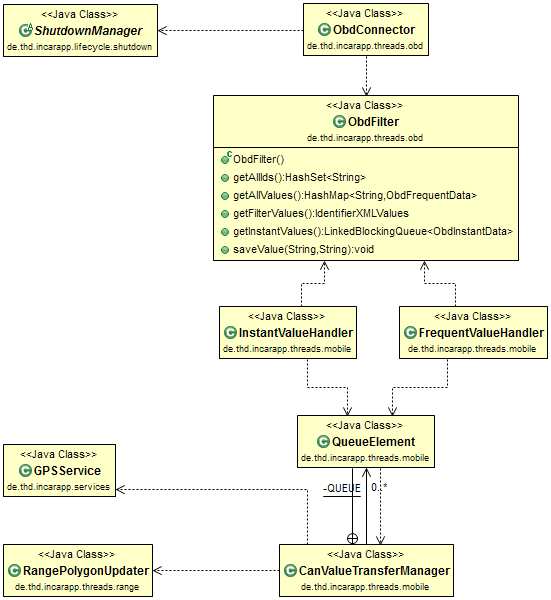
Figure 3. E-WALD InCarApp class structure, version 11.
A crucial point here that lends itself to optimization can be seen in the class CanValueTransferManager. This is actually the main data hub of the original app and is responsible for sending data to a server. However, this class was originally designed to send CAN values only (as can already be guessed from its name) and is therefore not well extensible to include other data as well. In fact, in order to send additional data such as GPS coordinates, it is necessary to modify the code of CanValueTransferManager (it has to pull the new value from the class GPSService). Instead, one would rather like to simply submit new data via some connection broker.
In addition, there are direct dependencies to classes which are responsible for rather unrelated aspects of the overall app. For instance, in case of a lost connection to the CAN bus, the class ObdConnector directly tries to restart the app by sending a message to ShutdownManager. In another case, CanValueTransferManager also decides that a new computation should be triggered in class RangePolygonUpdater, although this decision has nothing to do with the communication itself.
Also, the frequency in which data is sent to the server has to be made explicit in the corresponding classes. This can also be seen in the relationship between classes.
Large parts of the original InCarApp have been refactored in an attempt to achieve those goals. The current version 12 encapsulates each of these aspects into stand-alone libraries which are completely independent from each other. The app was divided into two major parts during refactoring: on one hand, a helper project — the CAN-lib — was created that contains all necessary functionality to talk to the CAN bus, on the other hand, the remaining InCarApp contains the central data hub, but also functionality for server communication and end user presentation. For the purpose of this study, these parts where always viewed together as a single application.
Both the earlier version 11 and the refactored version 12 of the E-WALD InCarApp where subjected to a series of analyses using different metrics. In the following, we report about the result of this examination.
In this work, we report on the results of following metrics:
* Weighted Methods per Class (weight 1)
* Number of Public Methods
* Non-Commented Source Statements
* McCabe‘s Cyclomatic Complexity
* Maximum Nesting Depth
* Coupling Between Object classes
* Afferent Coupling
* Clone Coverage (minimum clone length: 10 lines)
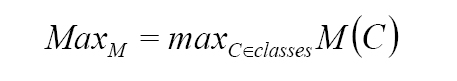
For each metric M, we calculate the maximum value observed across the different classes C:
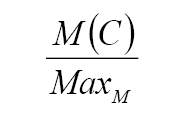
For each class C and each metric M, we then build the ratio
The rank of a class C, R(C), then is given by the sum across all metrics considered:
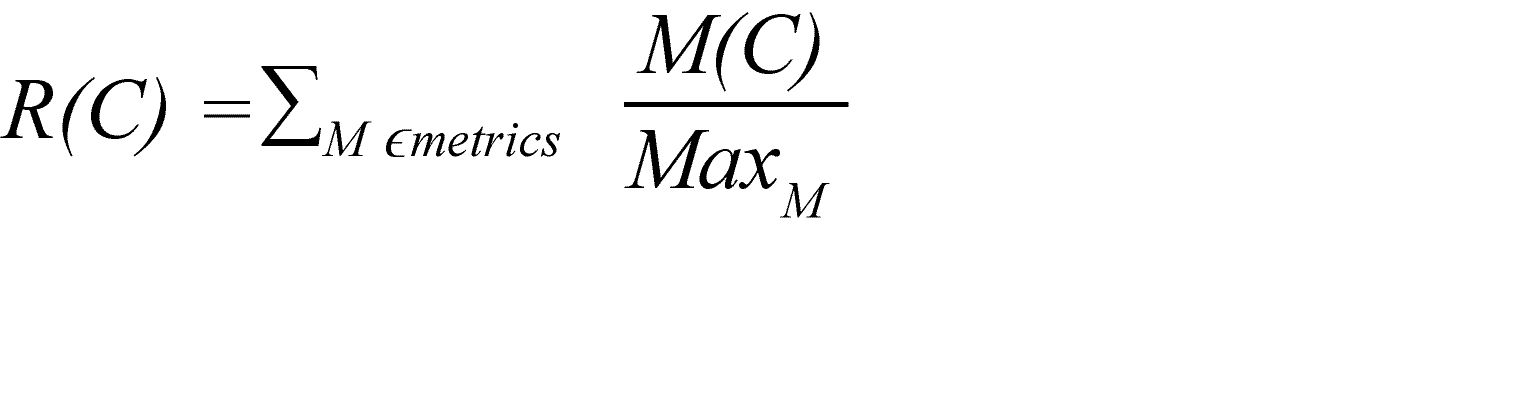
Thus, the highest rank specifies the class with the highest metric values overall. In our case, for each metric, a higher value means a less favorable outcome (our aim are few, concise, uncoupled methods and classes).
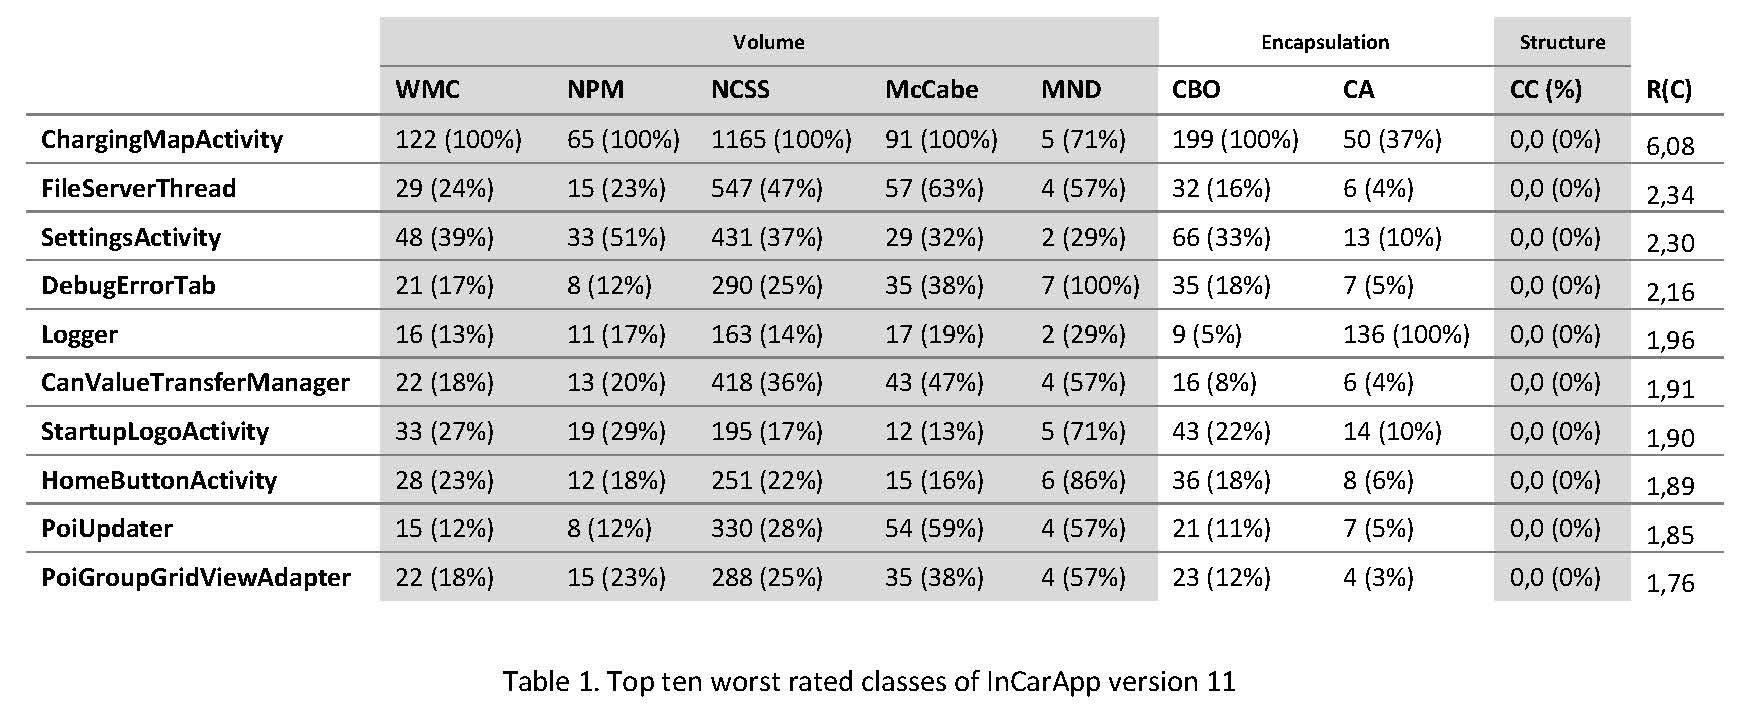
Table 2. Top ten worst rated classes of InCarApp version 11.
Table 2 shows the top ten classes in descending order according to their rank R(C) as they appear in version 11 of the E-WALD app. The whole app contains 151 classes. Metric values here are supplied as absolute numbers, but also as percentage with respect to the corresponding maximum values in the project. Table 1 shows ChargingMapActivity as the number one target for refactoring. CanValueTransferManager, a class that had already been speculated as a good candidate for refactoring, ranks at number six among the top ten highest ranking classes. Further classes in this top ten list include FileServerThread, PoiUpdater, which had also already been on the developers’ list. In contrast to those classes, HomeButtonActivity, number eight on the top ten list, had not been an a-priori candidate for the developers. However, a closer examination reveals that the class contains several unnecessarily deeply nested try blocks. These make the implementation harder to understand and were flagged due to the high value of MND. On the other hand, there are classes like Logger that rank quite high in the list, although they cannot be identified as a valid target for refactoring. In the example of the Logger class, this is primarily due to the fact that the class has to be called from almost all other classes, and is therefore coupled quite closely to those other classes (yielding a CA rating of 136, which is the maximum CA value of all classes).
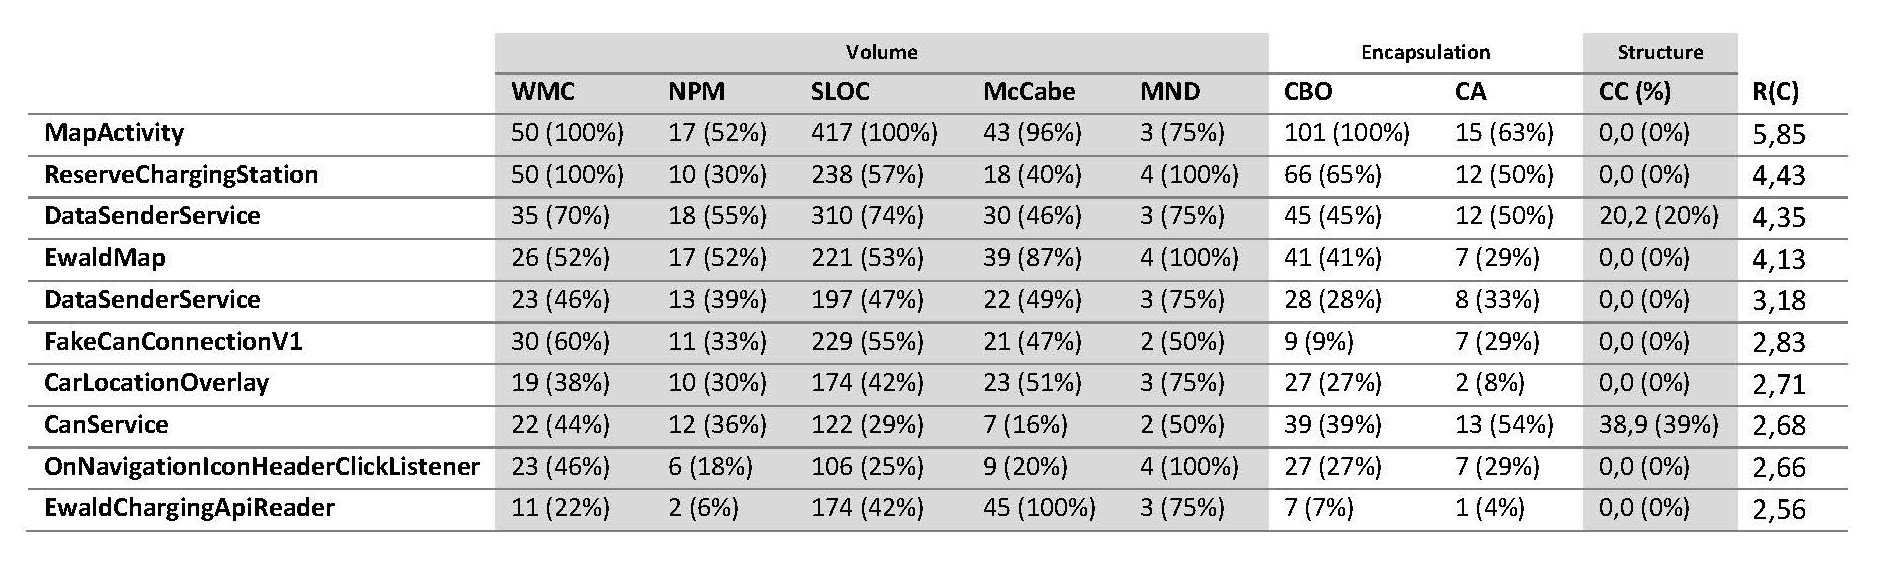
Table 3. Top ten worst rated classes of InCarApp version 12.
Table 3 shows the same top ten ranking for the 205 classes of version 12 of the E-WALD InCarApp. MapActivity (which had been refactored into MapActivity and the also high-ranking EwaldMap) still leads the ranking of classes to be refactored. Nevertheless, although this class remains a candidate for further improvement, the absolute values were remarkably reduced for all metrics considered, indicating that the refactoring effort indeed showed some effect. Again, the classes that leave room for improvement in the view of the developers also rank high according to our top ten list. An example is DataSenderService, ranking on place five. This class is still thought to have too high a degree of different responsibilities, which could be improved upon in further releases.
In order to evaluate the changes between version 11 and 12 of the E-WALD InCarApp, we also considered the average rating of all classes according to the different metrics considered. For each metric M, we calculated the average value A(M) of the metric across all classes of an app version:
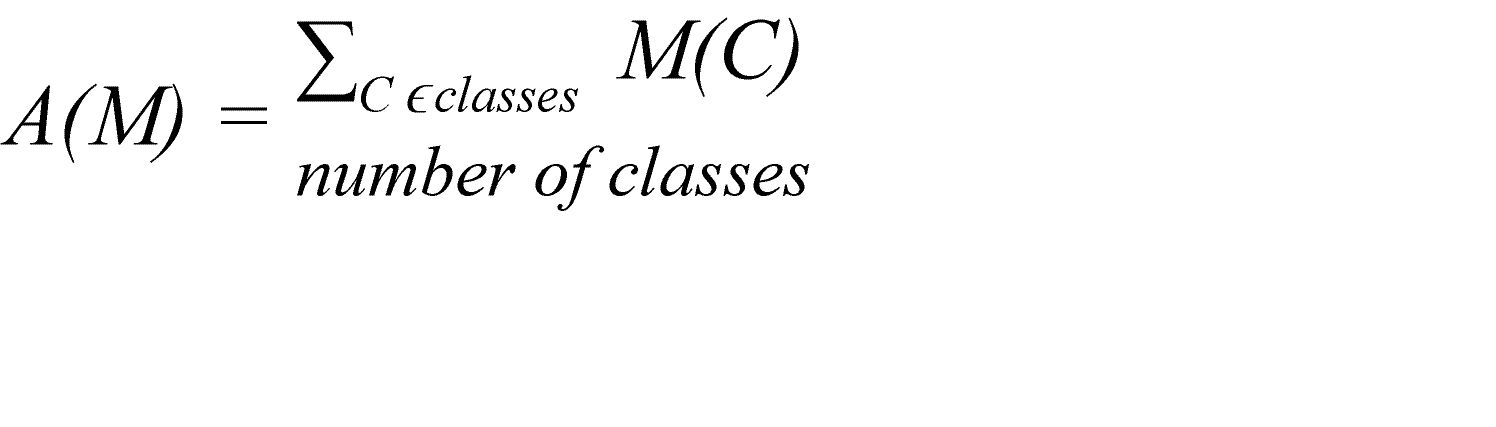
Figure 4 shows the ratio of these averages between version 11 and 12 of the InCarApp. As can be gleaned from Figure 4, almost all relevant metric values have been reduced on average in version 12 of the app, with the lowest reduction in the number of methods (WMC): the new version still uses 79% of the number of methods per class in comparison to the previous version. The highest reduction can be seen in Afferent Couplings (CA), which now average at only 50% of the previous values.
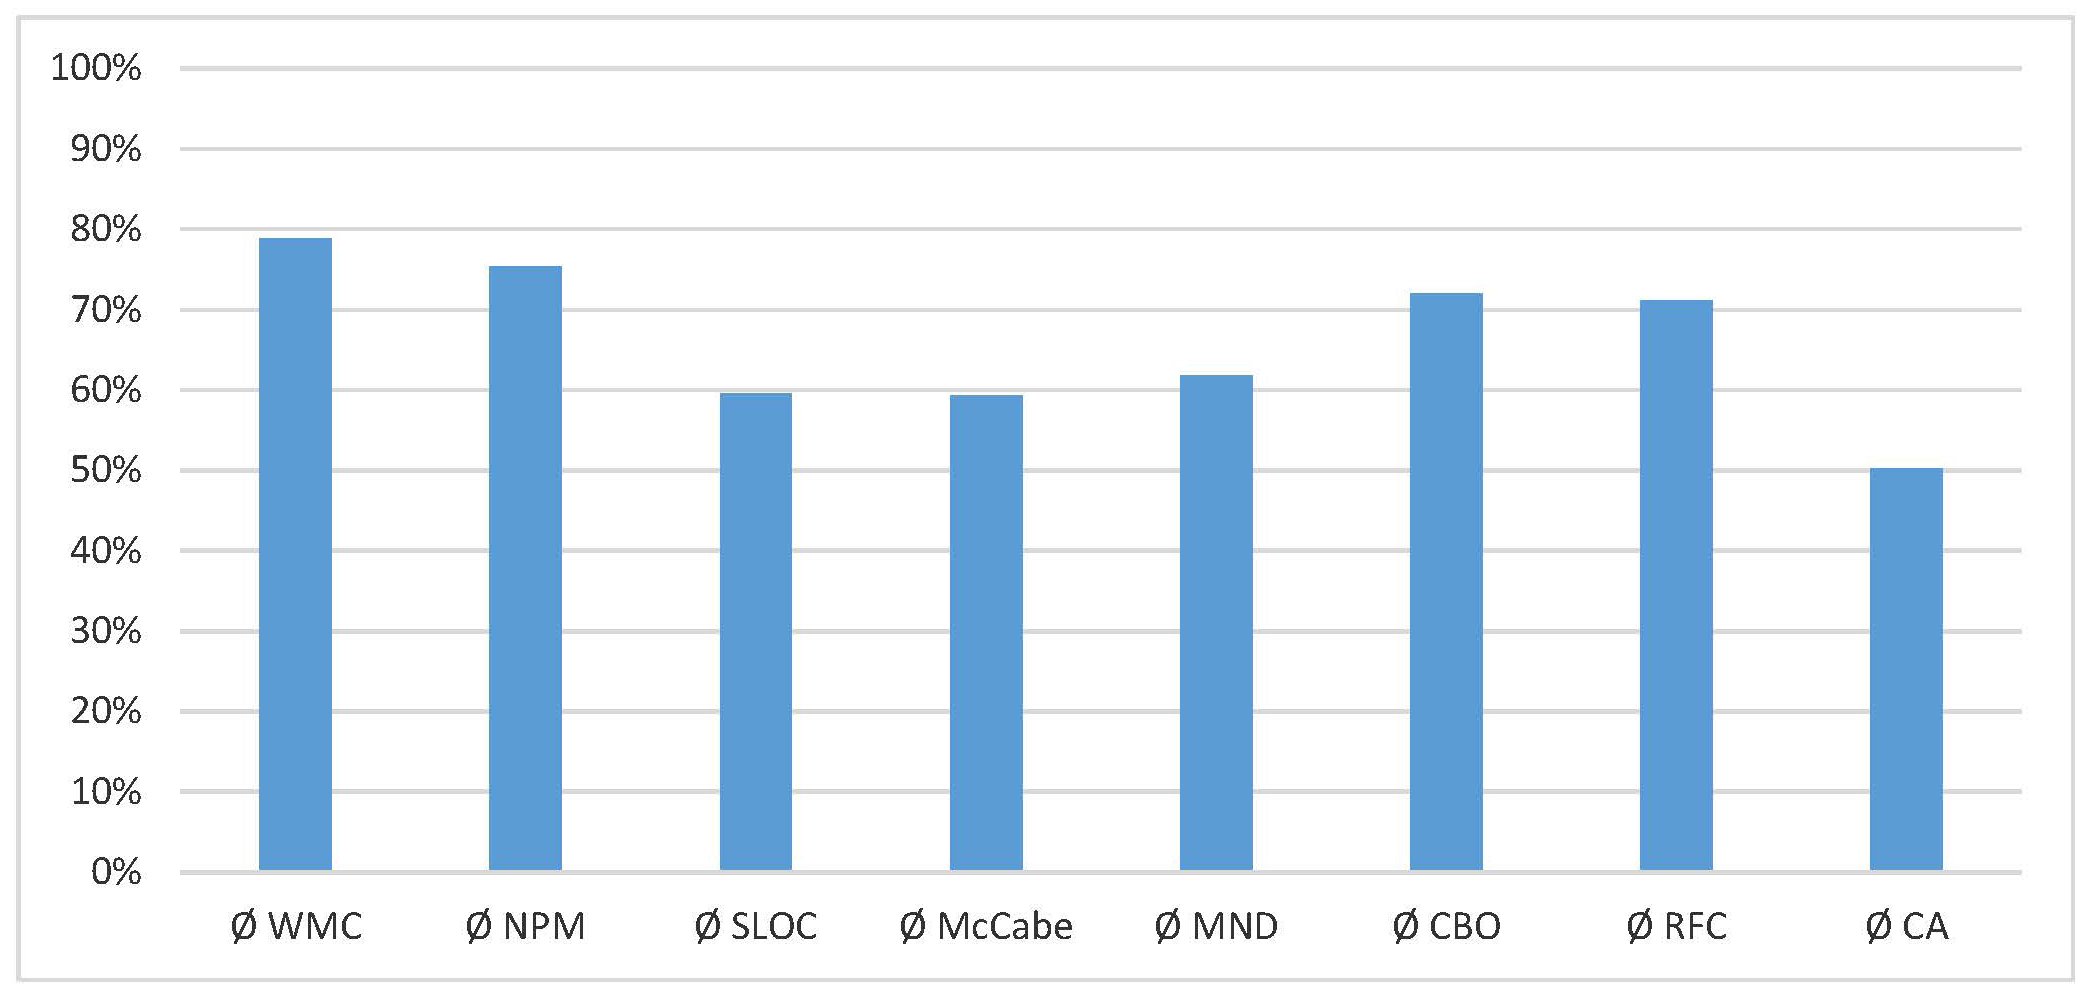
Figure 4. Relative changes between version 11 and version 12 of the InCarApp; the metric values for version 11 correspond to 100%.
Still, there is one exception that is not explicitly shown in Figure 4: The clone coverage actually increased from 1.7% to 8.7% in the new version. This is probably due to the fact that the InCarApp is still in the process of refactoring, in which certain classes have been copied in order to guarantee functional equivalence during recoding.
5. Conclusion and Future Work
Overall, our findings can be summarized as follows:
* Software metrics can indeed hint quite well at hot spots in a software project, even in the case of a larger, grown Android app project.
* Nevertheless, the decision about which hot spots are really in need of a redesign should never be made blindly following the numbers any code metric (or combination thereof) produces (e.g. a logger class will usually be coupled with many other classes).
* Using a ranking method like mentioned above may not yield an authoritative answer as to which packages and classes should be refactored, but it does give a good priority list on which classes to have a look at first.
* For agile development methods in particular – that generally work with frequent code changes – plug-ins can greatly improve development. However, encapsulation-based metrics – which could help in the coding process – are almost never found in tools that can be used as plug-ins.
The metrics considered here are strictly syntax-based. An interesting point lies in how far semantic aspects could be integrated into code metrics, e.g. simply by identifying semantically related expressions or defining structural patterns. As a first step, however, more metrics from different fields should be included in our consideration, and the crucial point of creating a ranking function – which may be quite project-specific – requires thorough quantitative analysis.
6. Disclaimer
The authors are not aware of any conflicts of interest.
7. Acknowledgements
The authors wish to thank the software developers of the E-WALD project team, in particular Mr. Michael Schönberger, who supported this work in numerous interviews and discussions.
The E-WALD project is funded by the Bavarian State Ministry for Economic Affairs and Media, Energy and Technology.
8. References
[1] Ebert, Christof; Dumke, Reiner (1996): Software-Metriken in der Praxis. Einführung und Anwendung von Software-Metriken in der industriellen Praxis. Berlin et al.: Springer.
[2] Spinellis, Diomidis (2005): “Metric Descriptions.” [Online]. Available: http://www.spinellis.gr/sw/ckjm/doc/metric.html. (Accessed: June 20, 2016).
[3] Spinellis, Diomidis (2005): “Tool Writing: A Forgotten Art?” In: IEEE Software: IEEE Computer Society Press, Los Alamitos, CA, USA 22 (4), pp. 9–11.
[4] Schneider, Kurt (2012): Abenteuer Softwarequalität. Grundlagen und Verfahren für Qualitätssicherung und Qualitätsmanagement. Heidelberg: Dpunkt.verlag.
[5] Heinemann, Lars; Hummel, Benjamin; Steidl, Daniela (2014): “Teamscale: Software Quality Control In Real-Time.” In: Companion Proceedings of the 36th International Conference on Software Engineering (ICSE ‚14). New York: ACM, pp. 592–595.
[6] Littlefair, Tim (2001): An Investigation into the Use of Software Code Metrics in the Industrial Software Development Environment. Ph.D. Thesis. Edith Cowen University, Perth, Western Australia. Faculty of Communications, Health and Science.
[7] Chidamber, Shyam R.; Kemerer, Chris F. (1994): „A Metrics Suite for Object Oriented Design.” In: IEEE Transactions on Software Engineering 20 (6), pp. 476–493.
[8] Ferenc, Rudolf; Langó, László; Siket, István; Gyimóthy, Tibor; Bakota, Tibor (2014): “Source Meter Sonar Qube Plug-in.” In: Proceedings of the 14th IEEE International Working Conference on Source Code Analysis and Manipulation (SCAM) 2014, pp. 77–82.
[9] McCabe, Thomas J. (1976): “A Complexity Measure. In: Proceedings of the 2nd International Conference on Software” Engineering (ICSE ‚76): IEEE Transactions on Software Engineering (Vol. SE-2, 4), pp. 308–320.
[10] Liggesmeyer, Peter (2009): Software-Qualität. Testen, Analysieren und Verifizieren von Software. 2nd Ed. Heidelberg: Spektrum Akademischer Verlag.
[11] FrontEndART: SourceMeter Project Homepage. [Online]. Available: https://www.sourcemeter.com. (Accessed: July 24, 2016).
[12] Oliveira, Marcio F.S.; Redin, Ricardo Miotto; Carro, Luigi; da Cunha Lamb, Luís; Wagner, Flávio Rech (2008): “Software Quality Metrics And Their Impact On Embedded Software.” In: 5th International Workshop on Model-based Methodologies for Pervasive and Embedded Software (MOMPES) 2008: IEEE, pp. 68–77.
[13] Göde, Nils; Hummel, Benjamin; Juergens, Elmar (2012): “What Clone Coverage Can Tell.” In: Proceedings of the 6th International Workshop on Software Clones (IWSC ‚12) (IEEE Computer Society), pp. 90–91.
[14] hello2morrow GmbH: Sonargraph Homepage. [Online]. Available: https://www.hello2morrow.com/doc/sg7/index.html. 2014. (Accessed: July 30, 2016).
[15] Martin, Robert C. (1995): Object Oriented Design Quality Metrics: An Analysis Of Dependencies. In: C++ Report (SIGS Publications Group) Software Metrics and Android Programming (September/October).
[16] Checkstyle Project: Checkstyle Homepage: [Online]. Available: http://checkstyle.sourceforge.net/index.html (Accessed: July 29, 2016).
[17] CQSE: Teamscale Homepage. [Online]. Available: https://www.cqse.eu/en/products/teamscale/features. (Accessed: July 27, 2016).

Prof. Dr. Peter Faber
Peter Faber holds a Diploma degree in Computer Science from the University of Passau. From the same institution he received his doctorate on the subject of code optimization in the polyhedron model.
Between 1999 and 2004, he worked as a scientist at GMD – Forschungszentrum Informationstechnik – and at the University of Passau, and from 2005 to 2009 as IT consultant and software engineer at science+computing ag. Since 2009, he has been professor for Media Technology at Technische Hochschule Deggendorf (THD). Since 2015, he has been the academic head of THD’s Computing Center. In research and teaching, his activities include programming and code optimization, in particular graphics and parallel programming, as well as programming of mobile devices.
Peter Faber erhielt sein Diplom in Informatik von der Universität Passau. Dort promovierte er auch zum Thema der Optimierung von Schleifenprogrammen im Polyedermodell (Code optimization in the polyhedron model).
Zwischen 1999 und 2004 arbeitete er als Wissenschaftler an der GMD – Forschungszentrum Informationstechnik – und an der Universität Passau und von 2005 bis 2009 als IT-Consultant und Software-Engineer bei der science+computing ag. Seit 2009 ist er Professor für Medientechnik an der Technischen Hochschule Deggendorf (THD), seit 2015 zudem wissenschaftlicher Leiter des Rechenzentrums der THD. In Forschung und Lehre ist er aktiv im Bereich der Programmierung und Codeoptimierung, insbesondere der Grafik- und Parallelprogrammierung (GPGPU) und der Programmierung mobiler Geräte.
Kontakt / Contact:

Tanja Maier, B. Eng.
Tanja Maier is a software engineer at Innowerk-IT GmbH, a software and IT company. She received her Bachelor of Engineering degree in Media Technology with a focus on Media Computer Science from Technische Hochschule Deggendorf (THD). She subsequently enrolled in THD’s Master’s Program Media Technology with an emphasis on Industrial Multimedia. As a student trainee, she has been developing software within various software projects while studying at THD. For her Master‘s thesis, she is examining the role of software metrics in practical experience.
Tanja Maier ist Software-Engineer bei Innowerk-IT GmbH, einem Software- und IT-Beratungsunternehmen. An das Studium der Medientechnik an der Technischen Hochschule Deggendorf (THD) mit Schwerpunkt Medieninformatik (B. Eng.) schloss sie das Masterstudium Medientechnik und -produktion an der THD mit Schwerpunkt Industrielles Multimedia an. Neben dem Studium arbeitete sie bereits als Werkstudentin in verschiedenen Softwareprojekten als Software-Entwicklerin. Im Rahmen ihrer Master-Arbeit betrachtet sie die Rolle von Software-Metriken in der Praxis.
Kontakt / Contact:

Dipl.-Inf. Stefan Schuster
Stefan Schuster received his Diploma degree in Computer Science from the University of Passau, where he worked on several topics related to energy generation, such as the Algebraic Oil Project. Within this project, he developed symbolic-numeric methods to analyze oil production data. Since December 2014, he has been the responsible for the development of the Optimized Range Model within the E-WALD project, the largest demonstration project for electromobility in Germany.
Sein Informatikstudium absolvierte Stefan Schuster an der Universität Passau. Als wissenschaftlicher Mitarbeiter arbeitete er dort von 2008 bis 2014 in verschiedenen Projekten an Themen aus dem Bereich Energiegewinnung. So entwickelte er beispielsweise im Rahmen des Algebraic Oil Projects symbolisch-numerische Methoden zur Analyse von Ölproduktionsdaten. Seit Dezember 2014 ist er im E-WALD-Projekt u.a. für die Umsetzung des Optimierten Reichweitenmodells verantwortlich.
Kontakt / Contact: