Leistungsbeurteilung von Prüfungssoftware
DOI Nr.: https://doi.org/10.25929/ed0s-n769
Georg Herde
Technische Hochschule Deggendorf
Dominik Fischer
ABSTRACT
Werkzeuge zur Datenanalyse sind eine bekannte Technologie. Aufgrund der zunehmenden Menge an Daten, die diese Werkzeuge bearbeiten müssen, wird es immer wichtiger zu wissen, wie effizient diese Werkzeuge Standardabfragealgorithmen ausführen. Dieser Aufsatz beschreibt die Planung, Entwicklung und Durchführung eines flexiblen Leistungsmessprojekts. Es beschreibt die verschiedenen Hardwarekomponenten und Betriebssoftware-Umgebungen für diejenigen, die mit Performance-Messung zu tun haben. Diese Entwicklung kann mit verschiedenen Anwendungen, die in der Lage sind, Batch-Operationen auszuführen, verwendet werden. Leistungstestergebnisse (zusätzliche Datei) werden vorgestellt und interpretiert.
Data analysis tools are a well-known technology. Due to the increasing amount of data such tools have to handle, it is becoming more and more important to know how efficiently these tools can execute standard query algorithms. This paper describes the planning, development, and execution of a flexible performance measurement project. It provides information on the different hardware components and operating software environments to those who want to do performance measurement tests on software. This development can be used with different applications capable of batch operations. Performance test results (additional file) will be presented and interpreted.
KEYWORDS
Big Data, Performance Measurement, Data Analysis Tools, Audit
1. Introduction
Big Data is not a completely new issue. Since the early days of data processing, people have had to manage the amount of data with currently available means [1].
However, the increase—almost explosion—of data availability in the last few years has also made it necessary for most companies to dig for the gold [2] within.
The audit profession is no exception: the need for software tools to test and check a company’s data for auditing purposes has been felt for 40 years [3].
Changes in at least three different aspects can be observed in comparison with previous years.
1. More and more business processes are purely digital, as in B2B or B2C business.
2. The number and variety of attributes recorded for each transaction is increasing; therefore the test procedures are becoming increasingly complex.
3. Exponential growth in the number of digital transactions has not only been observed in big companies.
Auditors have realized that, in order to gain a deeper understanding of company processes in terms of audits, digital data analysis is no longer an option. It has become compulsory.
Many different general-purpose and specific tools are now available in the audit field.
In a survey on acceptance of digital data analysis in the audit profession in Germany, Herde/Kohl [4] found that 76% of internal auditors and 81% of external auditors use digital data analysis tools. The most frequently named products were ACL, Excel, Access, IDEA Monarch, SPSS, SAS and Statistica, among others. Most interviewees agreed that digital data analysis tools are either indispensable or their importance will increase considerably in the near future [4]. Kaplan [5] obtained similar results in his Survey report on Data Analysis Software and Auditors.
It will therefore become necessary for the audit profession to accept available software tools and applications as a given constant. Defining the requirements and parameters according to which software applications can be evaluated in terms of effectiveness and efficiency [6] will consequently become more important. Several general-purpose audit software packages apart from the Microsoft Office applications are available on the market and used by audit professionals.
The more important the use of such applications becomes, the more people work with these applications, and the more data these applications have to handle, the more critical becomes the question: How efficient are these applications in analyzing mass data?
When introducing audit software tools, auditors have to take the efficiency of those products into consideration.
Apart from the user interface, functionality and training effort requirement, it would be interesting to know how much time a software tool would require to execute a sort or a classification, or to compute a join between two tables, which are really basic and recurring tests in almost every audit procedure.
The question that will be explored in this paper is:
How do different audit software programs behave in terms of, e.g. CPU usage and disk usage, when executing simple audit routines on millions of data records in different hardware environments?
The results will indicate the software tool that uses less resources and consequently takes less time for auditors to do their jobs.
The test procedure, tools, and parameters selected in order to answer the question will be explained next.
2. Planning
Several decisions had to be made at the outset: the data analysis tools and data operations (query algorithms) to be tested; the mandatory parameters to measure; and of course the way in which the tests should be performed. This paper explains these steps and includes the decision-making.
2.1 Selection of the Data Analysis Tools
There are many different tools for digital data analysis on the market, starting from standard software like Microsoft Excel all the way up to high-end solutions from SAP or IBM. For the purpose of our project, it was important that the tools fulfil the following requirements:
- are able to compute data of the size of a five-digit Megabyte file;
- are specifically for data analysis in the audit profession; and
- are standalone tools.
Standard office tools are automatically disqualified by these restrictions: Microsoft Excel can only compute up to “1,048,576 rows” [7] and Microsoft Access “2 Gigabytes” [8] of data. If the market is filtered, a long list of possible data analysis tools results.
“The three most well-known and common data interrogation packages are …, Audicon IDEA, ACL and i2. … In addition, there are other data interrogation packages; for example CPCP … which runs in ARBUTUS, a spin-off development, when one of the key ACL developers left, to set up his own development.” [9] Due to the fact that IDEA and ACL are two of the market leaders, an initial decision for these tools was made. The ARBUTUS tool, a tool with the same philosophy, but from a different company, has also been included.
Following an early presentation of our project in mid-2012, a senior consultant at “hfp Informationssysteme” contacted us. His company also develops software to analyze data for audit professionals that has a different structure and philosophy to the other three and is capable of using different database servers in the background. Since it is also interesting to test computations with relational databases, the software “hfp openAnalyzer” in combination with the Microsoft SQL Server 2012 was added as the final product to our project.
In conclusion, the four tested data analysis tools are:
- Caseware IDEA 8.5
- ACL 10
- ARBUTUS Analyzer 5.5
- hfp openAnalyzer v. 2.5b
2.2 Data query algorithms
There is a huge range of specific data selection and modification procedures within the software programs. In the case of digital data analysis, the selection procedures (reading) are more important than the modification (writing) procedures, because they occur more often in an audit procedure. All our tools use a fixed data set, which is normally extracted from an ERP system such as SAP. All tests will be driven on one fixed data set.
There is a very wide range of data selection procedures, starting from easy row selection without much inherent logic, through several aggregation and grouping functions, up to really complex fraud and double payment scripts (which could also include data modification queries to store temporal data).
It was important to test query algorithms that are used quite frequently and generate similar results in each software package. These are very easy, basic operations, but essential for any further and more complex computation. They are comparable to the performance measurement of super computers where you test how many FLOPS (floating point operations per second) the computer can compute. The project thus focuses on simple data selection operations and not complex data computation algorithms.
Four different data query algorithms have been tested so far:
- Sort: Order a data set by three different columns.
- Join: Merge two different data sets with one primary and one foreign key in the tables.
- Summarize: Order and group a data set, and summarize the single groups in a numeric field.
- Extract: Export a data set to an XML-structured file and save it on the local disk
2.3 Performance parameters
“The performance and scalability of a software system are determined by the various performance and scalability factors. Those factors that are affecting the performance and scalability of a software system most are classified as the bottlenecks. System performance counters help capture those bottlenecks. A performance counter enabled through a system-monitoring tool is simply a logical entity that quantitatively represents one of the aspects of a resource. For example, one often needs to know:
- How busy the CPUs of a system are
- How much memory is being used by the application under test
- How busy the disks of a data storage system are
- … “ [10]
he performance parameters are the parameters defined to be measured. Surely, the most important and predicated parameter in the buying decision is the duration of an operation. How long does the computation of a function last? How long will the auditor have to wait until the operations have been performed?
It is necessary to measure some hardware parameters in order to analyze the performance of the algorithms of the different tools. The following attributes are measured:
- CPU rate;
- amount of written bytes on the storage drive;
- read bytes on the storage drive; and
- used space in working storage.
2.4 Test requirements
What is required to perform a representable test? What has to be done before and after a test? Due to the number of data records and test algorithms, our tests are very time-intensive, requiring special arrangements and tasks in order to maintain a comparable test environment. The important preconditions and requirements for our tests are described below.
We are testing different disk technologies and different working storage capacities, as well as different audit software with different operations and of course with different data sizes. All these tests should run automatically. Moreover, to maintain a comparable state of the system after each test run, the next test should start automatically. Consequently, the test environment was governed by the following conditions:
1. Before each test, the operating system has to be blank and every test run has to have the same starting conditions.
2. After each test, all generated data from the analysis tool has to be deleted.
3. No changes are allowed in the initial project data of the analysis tool and in the analyzed data set itself.
4. The system has to configure, shut down and boot itself, without any user interaction.
5. In order to avoid and polish positive and negative peaks of the measured data, the test environment should be able to repeat one given test a specific number of times.
6. It should be possible to generate and store measurement data over the whole test run. Performance has to be measured within an interval of only a few seconds.
2.5 Test Data output
In consideration of these preconditions, a calculation about the estimated test data results has been made. The following dimensions have to be considered in the planning scenario:
- type of disk;
- size of working storage;
- size of data set;
- type of audit software; and
- type of query algorithm.
In order to exclude outliers in the tests, each test was repeated five times and the median of the generated test data output was used.
More than 1,440 test runs had to be executed.
The complete execution time was initially expected to be round about three months. Due to unexpected performance shortcomings in some tools, the true execution time was round about 18 months.
More than 200 Megabytes of test results were generated during these tests.
3. Development of the test environment
Fulfilling all mentioned requirements and developing a test environment to perform all the tests automatically required some research and development activities. The entire development took more than 12 months and there is still scope for improvement to increase the performance of the test environment. The environment is, however, robust, produces representative data results, and can also be used for different use cases (i.e. it is possible to test software in different operating systems like Windows XP, 7, 8 with only one configuration).
3.1 The test data sets
As previously mentioned, the target was to test and stress the audit software using different query algorithms combined with three different huge data packages. Due to data security issues, it was difficult to get real data with the required huge number of data records. The data sets were therefore generated using software from “Red Gate Software Ltd” (http://www.red-gate.com/). Our table is 512 bytes wide and contains number, text, binary, and date fields. The following amounts of data have been generated:
- 7.5 GB (15 million records)
- 15.0 GB (30 million records)
- 22.5 GB (45 million records)
The data sets are big enough to force the software to use the internal hard disk or the page files on the hard disk (space for software when the physically memory is exhausted) rather than the limited physical working storage for computation. However, they are not too big to blow up the execution time of the single test runs.
3.2 Test process
The main part of the development of our test environment is the implementation of the strict test requirements. This is also the most complex part, cf. the graph on the last page of this article.
The test environment contains different parts with different responsibilities. On the one hand, the system has to manage two disks where the tests will run, under the control of a Windows 7 operating system. An additional disk runs a Linux environment, which is responsible for changing the hardware configurations and resetting the Windows system. Some independent partitions that store the actual test software, configuration files, logs of the test runs, test results, one partition for the project data, and one for a variety of different disk images, are also located on this disk. One disk image represents a software installation on the Windows system for each different test configuration (i.e., ACL with a Solid State Disk, another one for ACL with a magnetic hard disk). There are also several disk images for the hidden system partition of the Windows system. Amongst others, the partition also stores information about the size of the allocated working storage.
The reason for so many different data sets, partitions, and systems is derived from the high degree of flexibility and efficiency that should be achieved in the test environment. It is very easy to add additional software, change the project data, or update the measurement software with this constellation. The alternative would be to generate new disk images if there is a change in a single component. It is also necessary to understand how the various parts interact with each other (cf. the numbers in the brackets refer to the steps on the graph).
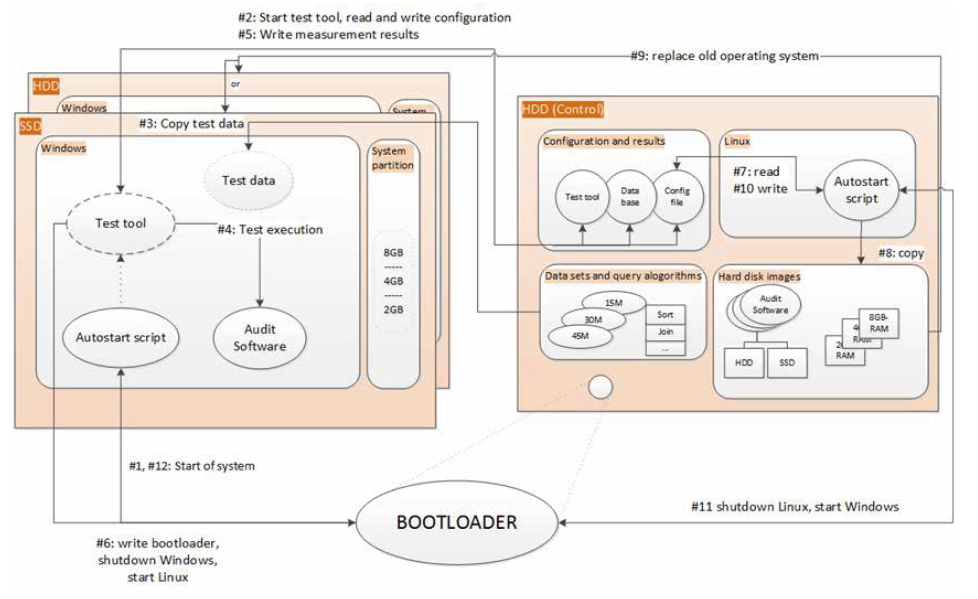
A small boot loader (GRUB, Grand Unified Bootloader) will establish which operating system will be booted to start the test environment. Normally, it should boot the Windows environment. An automatic start-up script is triggered after the system is booted (#1). This small script is responsible for starting the measurement software (#2). This is stored on the other disk to facilitate updating the software . If no test is planned, the software starts the graphical user interface and the system manager is able to configure the tests and the analysis software. Otherwise, after a delay of 30 seconds (delay for Windows to finish all start-up procedures), the software copies all necessary project data from the single data partition to the local drive (#3).
The test is performed as soon as the data has been copied and a measurement of all performance parameters will be taken every five seconds (#4). After the test, the results are written to the database (#5). If a next test run is planned, the system writes the next hardware and software configuration to a file and configures the boot loader to start the Linux system. The system then restarts automatically (#6).
There is also an automatic start-up script on the Linux system. This script reads the required configuration for the next tests (#7). It also copies the right disk images (e.g., “ACL on SSD” and “with 8 GB RAM”) (#8) and pastes it on the particular disk. The old data is deleted completely (#9). After writing the new state (#10), the system again reboots the Windows operating system and the process cycle starts once again (#11).
The possibility to break this cycle either for maintenance or to extract the test results certainly exists, e.g. on each Linux boot, the test results are copied to a flash drive where they can be easily extracted during the test routines. Planning and developing this test environment took a big part of the project research resources, but it was worthwhile since the advantages in performance, usability, and efficiency paid off immediately.
3.3 Test execution and measurement of performance parameters
The measurement software on the Windows system is responsible for two major parts:
a.Measurements of performance parameters
b.Test management and administration
The software is written in C# using the .NET Framework, a combination with very comfortable access to all performance parameters. “Performance Monitoring can be used to get information about the normal behavior of applications. Performance monitoring is a great tool that helps you understand the workload of the system and observe changes and trends … Microsoft Windows has many performance objects, such as System, Memory, Objects, Process, Processor, Thread, Cache, and so on. Each of these objects has many counts to monitor.” [11]
The project data is stored in a simple SQLite database. “SQLite is different from most other modern SQL databases in the sense that its primary goal is to be simple. SQLite strives to be simple, even if it leads to occasional inefficient implementations of some features. It is simple to maintain, customize, operate, administer, and embed in C applications.” [12]
3.4 The test environment
The test environment runs on a desktop personal computer (PC), which has been modified and configured for our measurement software. The test PC consequently cannot be used as a normal office PC.
All the different hardware features that should be tested have been implemented in the test environment. Besides the hard disk drive (HDD) for the Linux system and the data pool, a solid-state disk (SSD) and another HDD for the Windows operating systems have been installed. The relevant system specifications are: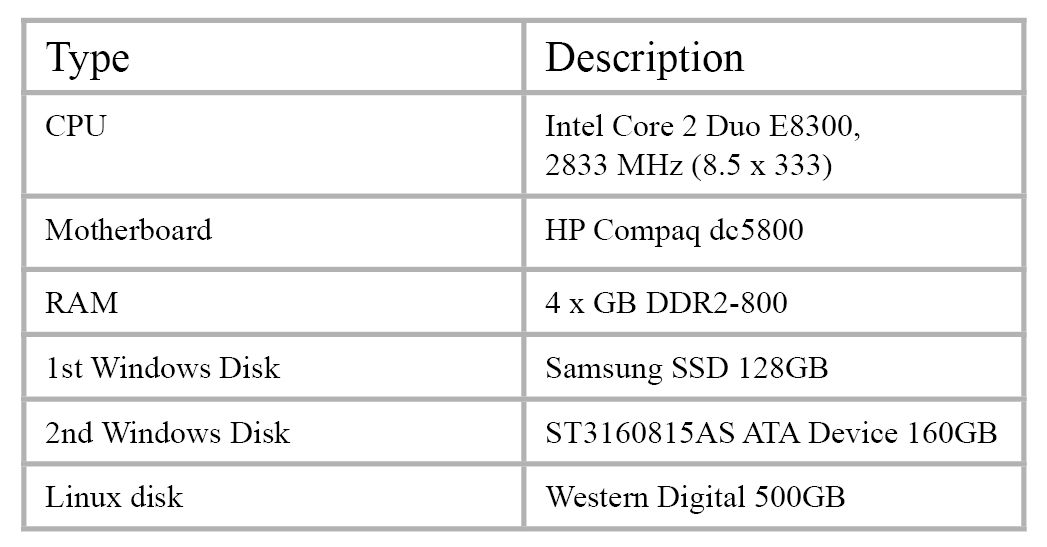
There are many more recent hardware components available on the market, but the hardware specifications are currently not a critical point—testing different CPUs or motherboards would extend the project far too much. Furthermore, our intention is to test with an average, available, and not too expensive system that could be used by any average end user. The results would not be that representative if the tests were executed on a high-end system available to only a minority of end users.
No network connection is available on the system in order to avoid any software update or other requests. Downloading and installing software, e.g. Windows updates, may affect system performance and consequently the measurements.
A very special feature of our test environment is simulating different hardware settings. It is not necessary to physically change the hardware settings, e.g. by plugging in more or less memory or the other disk. The test environment manages everything itself, guaranteeing maximum flexibility and automation.
4. Analysis
4.1 Validation
The result data sets had to be validated in terms of quantity and quality before further analysis. The quantity of database entries was first checked: the expected quantity was calculated and compared to the actual results in the database. Most test runs have a completeness rate of more than 98%. Furthermore, the logs were checked for error messages or exceptions during the test runs. Any identified unexpected problem or interruption had to be solved before the test was repeated.
4.2 Classification
Since reading or analyzing the measurement data is no simple matter, some procedures have been developed to automatically edit the data for further analysis. As previously mentioned, five executions of the same test were made for each test configuration. The median of each test run was first identified in order to eliminate negative or positive outliers of these runs from the analysis.
The test results were edited for better computation in the later visualization process. The original result table contains unformatted numbers and absolute date values (the creation date of the measurement record). After editing, all numbers are formatted and the date and time values are relative to the beginning of the test (seconds from the beginning of the test run).
4.3 Visualization
The main problem in the analysis is visualizing the different dimensions: showing the relation between the different factors and how they influence the performance of the different software packages.
A Python script generates a detailed PDF document containing visualized data by query algorithm and data size. It offers a fair overview. This script ultimately generated 57 pages with 189 different charts.
The whole Document with all figures (Figure 1 to 54) and with addtional
information can be downlaoded from: jas.bayern/data/herde/
5. Results
The most significant insights will be described in this section. An explanation for the proper understanding of the results will be followed by the presentation of the results.
5.1 Plot explanation
A short introduction on how to read the result plots is helpful. A 57-page document containing all results as single plots can be downlaoded from: jas.bayern/data/herde/. One particular test involving one of the query algorithm types and one of the three data sets, e.g., “EXTRACT with 15,000,000 rows”, alone covers six pages.
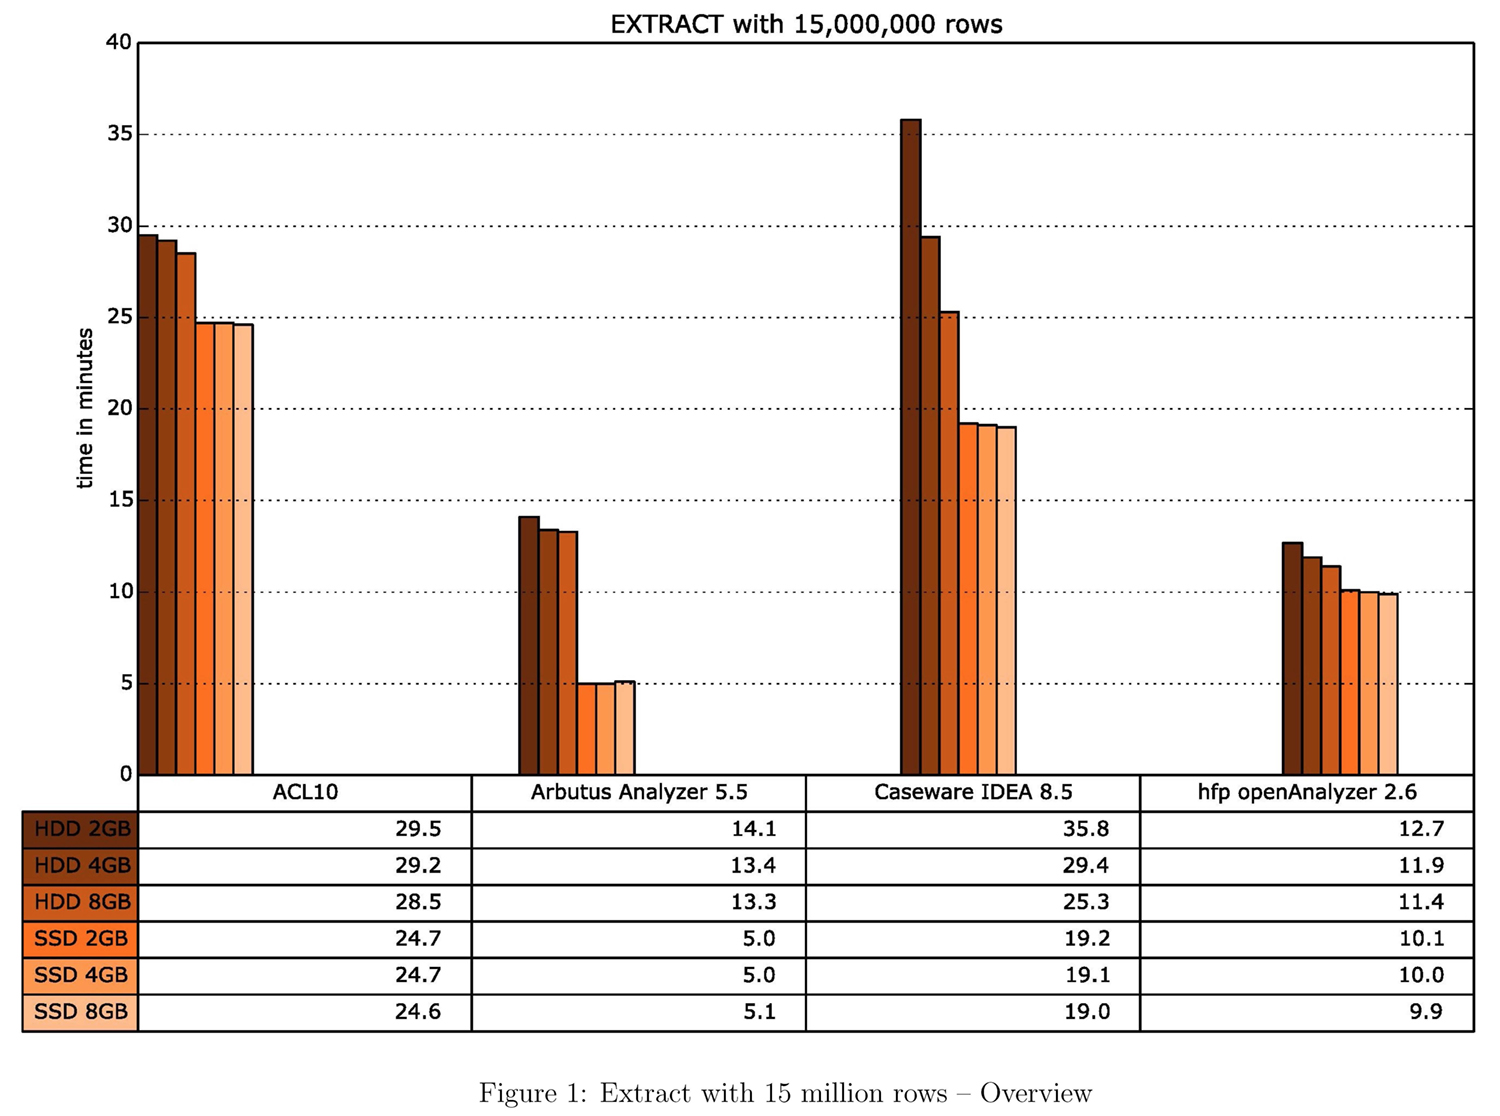
A bar chart on the first page of each test provides an overview. Each color represents a specific hardware configuration. The tests were each performed with six different configurations: from 2 GB to 8 GB working storage with an SSD and an HDD. The x-axis represents the duration of the test run in minutes, while the y-axis shows each test run grouped by the four tools.
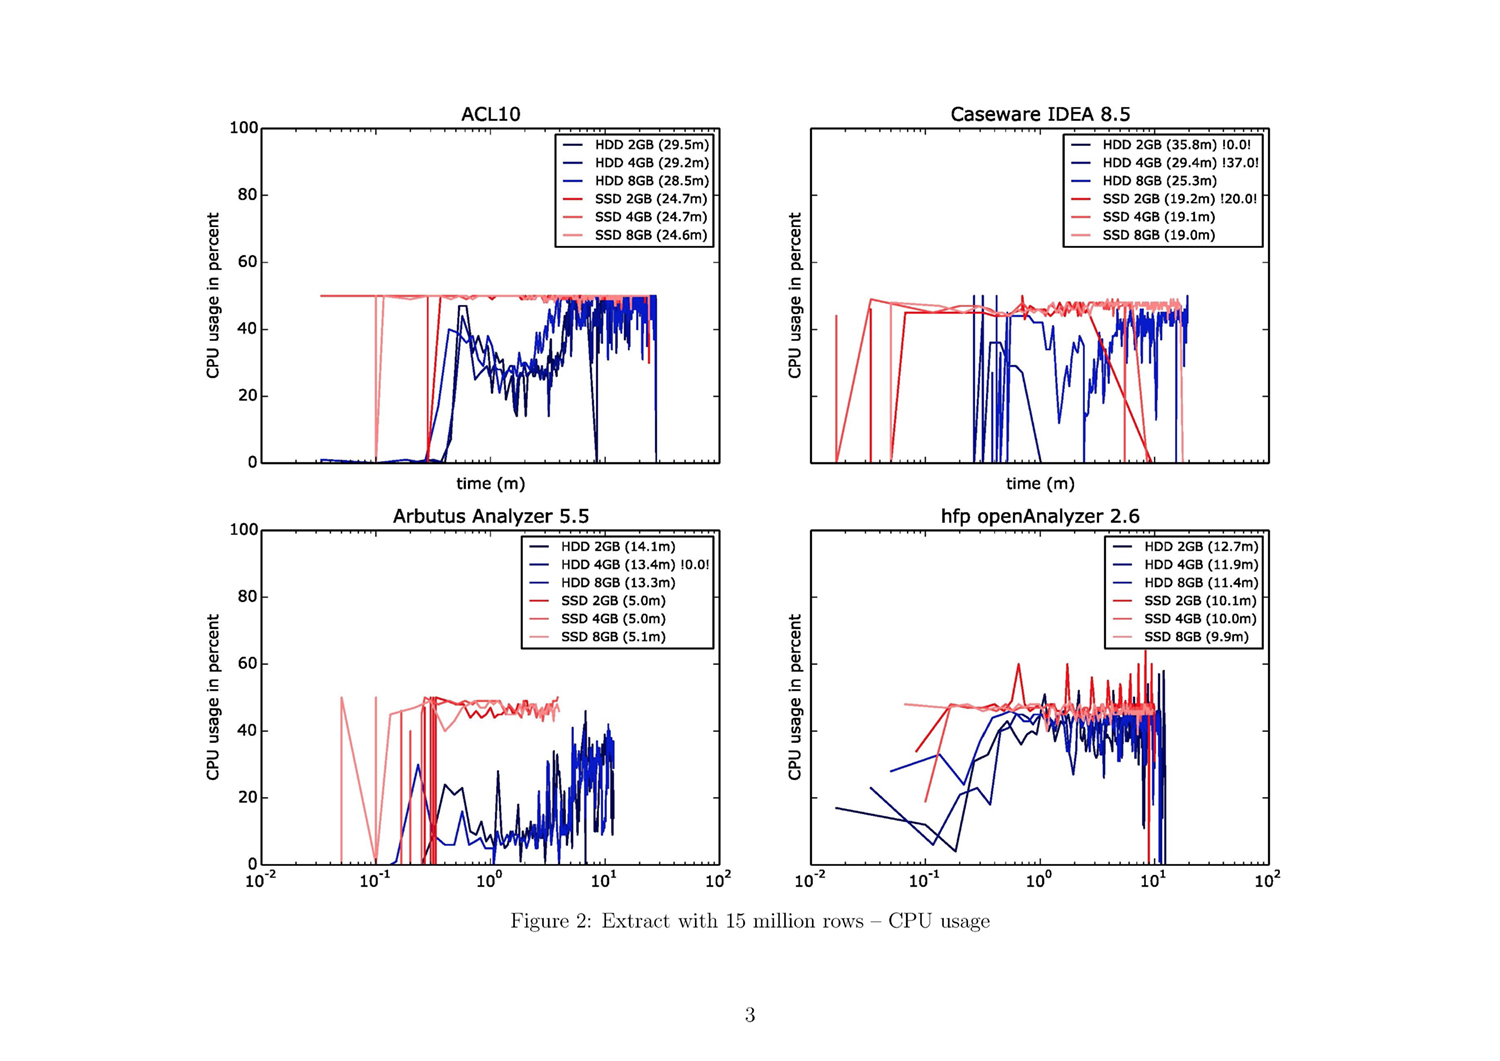
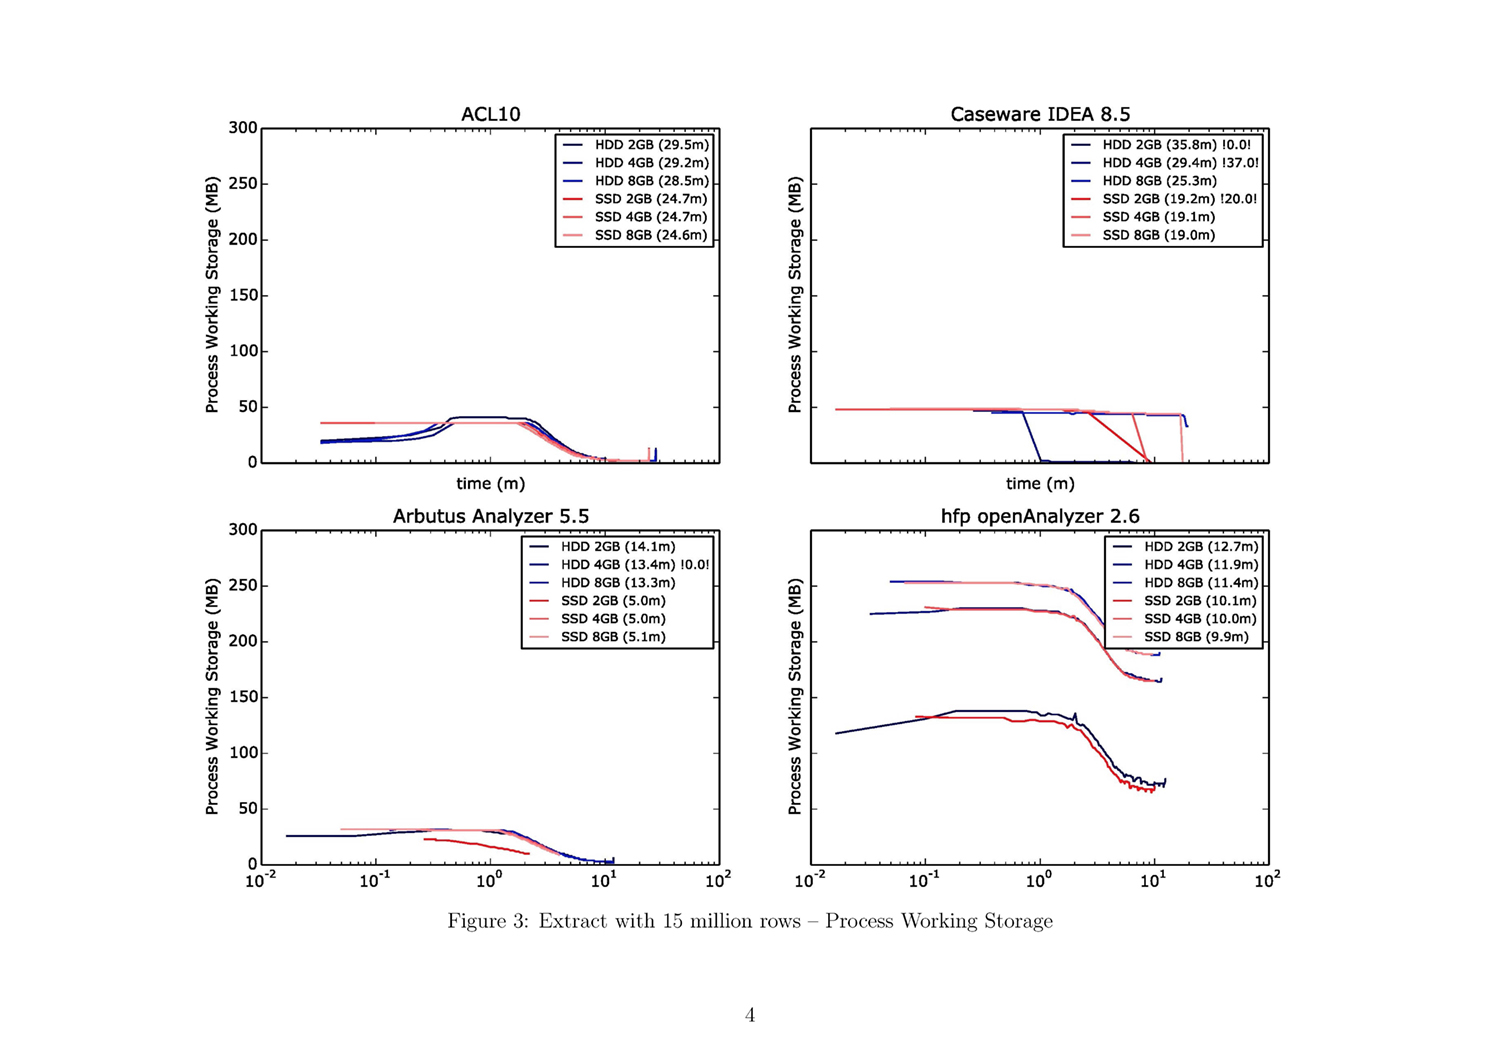
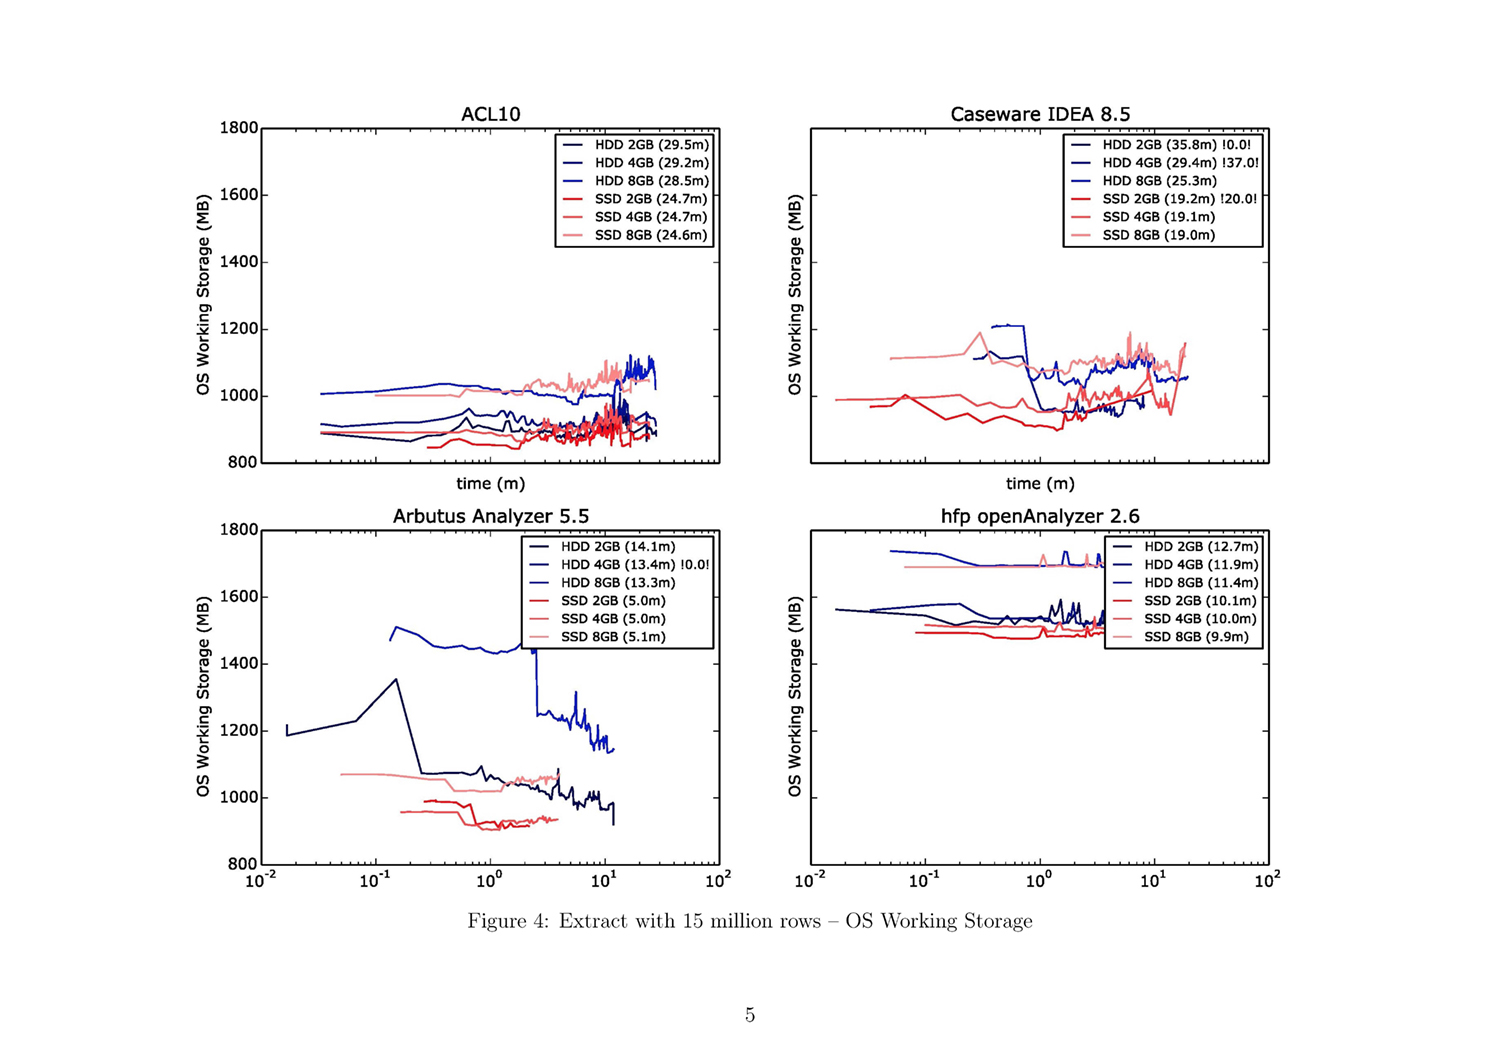
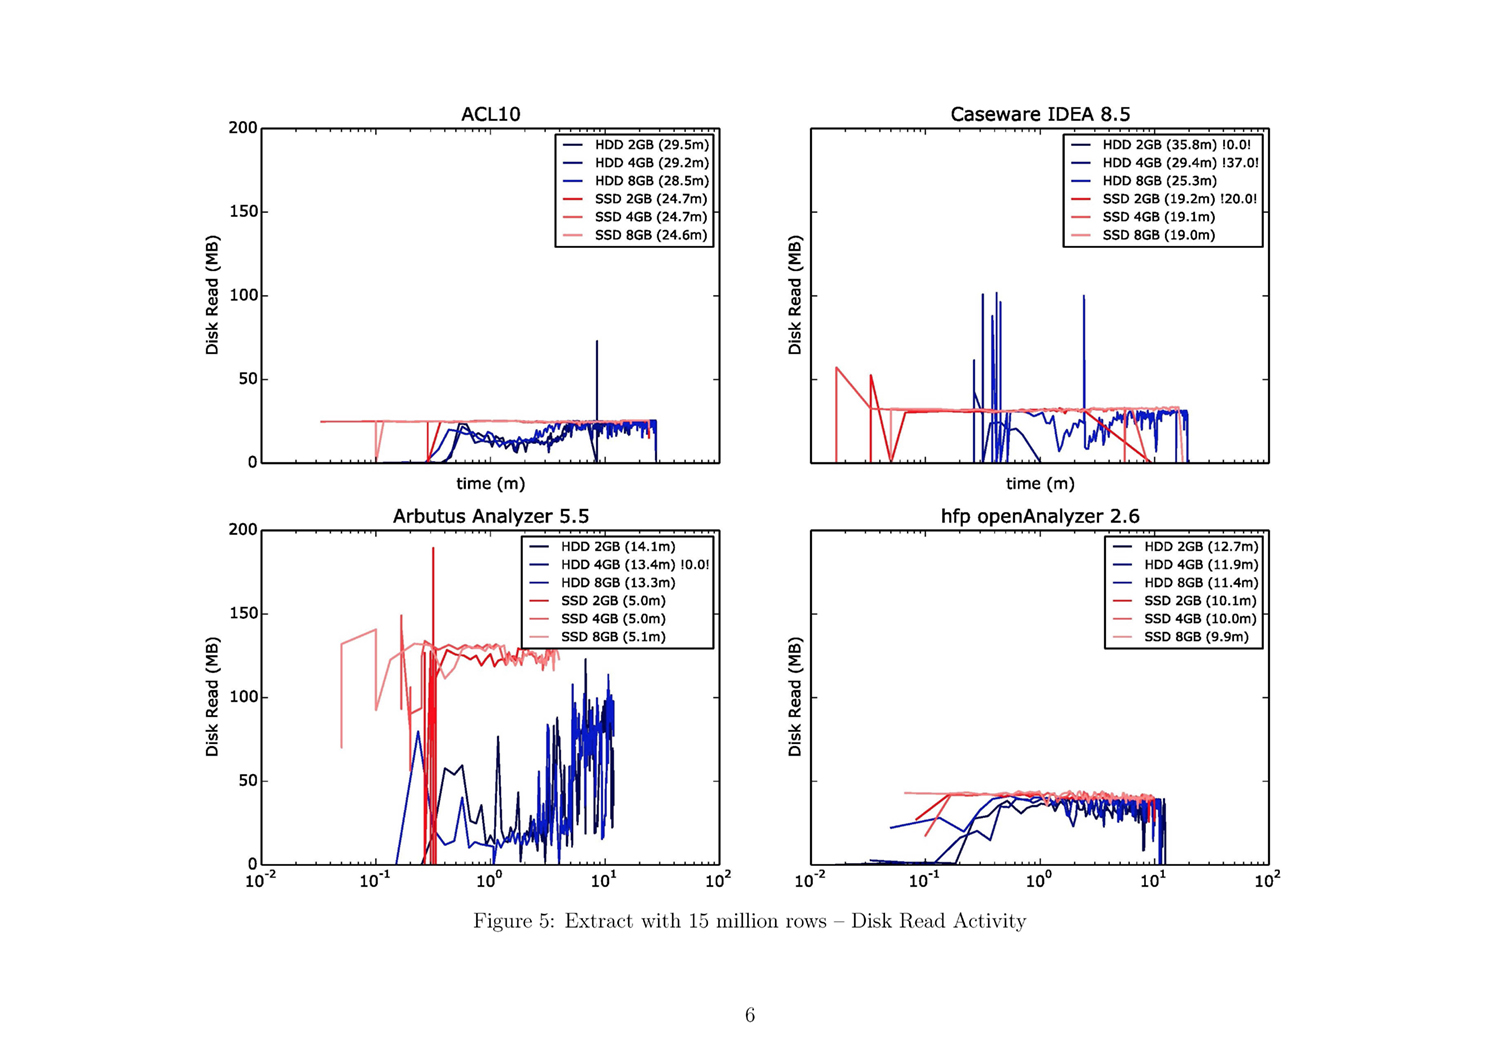
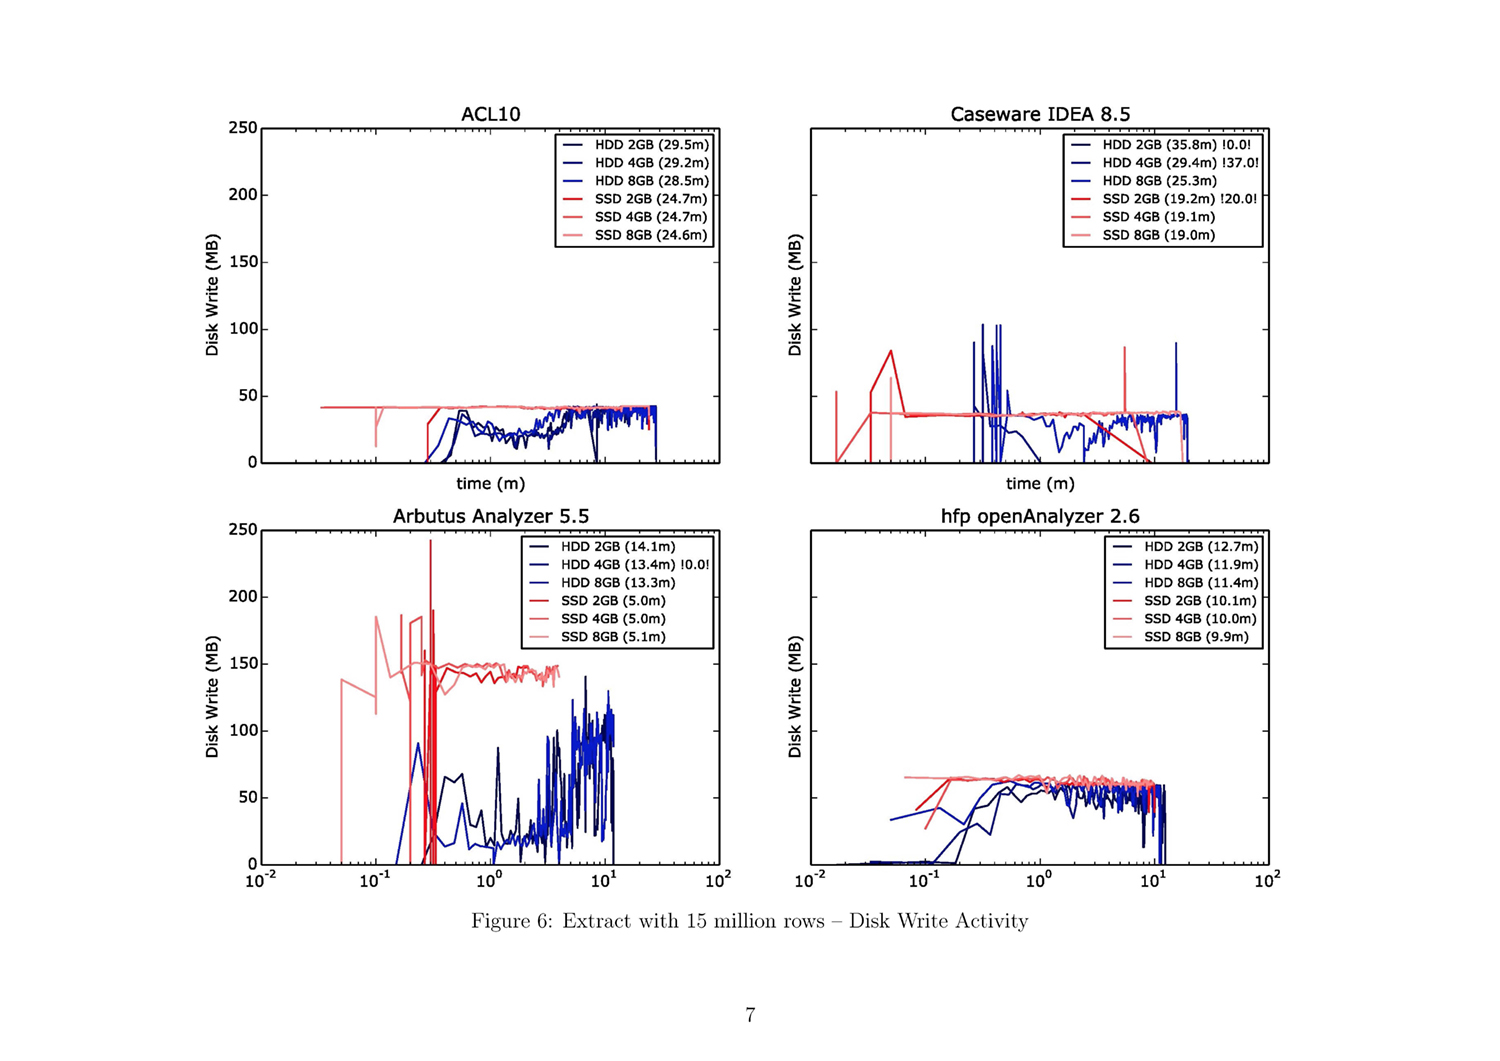
The subsequent five pages provide a detailed view of each of the five performance parameters: CPU usage, process working storage, OS working storage, and disk frequency for read and write activities. There are four plots per page, one for each tool. Each plot comprises three blue lines, representing the test runs with the HDD, and three red lines, representing those for the SSD. The x-axis is the value of the performance parameter and the y-axis is the time in minutes (in a logarithmic scale). The numbers in the brackets in the legend are the duration described in minutes. Tests with less than 50% test results are marked with two exclamation points enclosing the percentage of the expected test results (e.g., “!28.0!” indicates that 28% of the expected results could be measured).
Use the attached result document to find the figures referenced in the following paragraphs!
5.2 Data Extraction
- The two leading tools for the data extraction command are Arbutus and the hfp openAnalyzer (ref. fig. 1, fig. 7, fig. 13).
- Results specific to the SSD indicate that Arbutus is the fastest tool, followed by hfp, IDEA, and ACL.
- Expanding the physical working storage is only a significant advantage for IDEA running on an HDD.
- The CPU has a much higher workload with the SSD, but only one of two cores is used (ref. fig. 14).
- Hfp uses most of the available working storage, which is no major issue for the EXTRACT command. The high RAM workload in the case of Arbutus using the HDD and 8 GB RAM is noticeable. It seems that the software tries to use most of the available space (ref. fig. 16).
- Analogous to the ranking in duration is the behavior of read and write operations. Arbutus reads/writes the most data per second, followed by hfp, ACL, and IDEA. It is noticeable that in the cases of ACL and IDEA, the possible read/write-speed of the SSD is not fully attained: an imaginary border appears at around 50 MB per second (ref. fig. 17f).
5.3 Joining tables
- ACL, Arbutus, and hfp are at the same level at the beginning of the HDD test runs. However, hfp later requires nearly 100% more time for the test execution with the two bigger data sets. IDEA has massive problems using the HDD (ref. fig. 19, fig. 25, fig. 31). The execution time is unreasonably long. It is immediately apparent that more RAM speeds up execution. A pre-indexed data set generates no significant advantage
- In the SSD test runs, IDEA came in first on the smaller data sets. However, with a data set of 30 million rows, Arbutus and ACL are the two leading tools. Hfp cannot generate speed improvements using the SSD. This is due to the low disk activity in the join operation.
- There is no permanent CPU load during the join operation. It is however interesting that testing Arbutus in combination with an SSD results in usage of the second CPU core (ref. fig. 32).
- ACL and Arbutus seem to have an internal working storage limitation. The limitation in the case of ACL depends on the size of the RAM: when more RAM is available the limitation is not as strict as when less RAM is available. The working storage has a steady load across the different tools. Only IDEA shows a less high RAM workload (ref. fig. 34).
- ACL exhibits the highest read/write activity on the disk, followed by Arbutus. In the case of Arbutus, there is a big difference between the HDD and SSD test runs. Hfp and IDEA don’t have a very high read/write rate (ref. fig. 35f.).
5.4 Sorting data
- Execution time with the HDD test runs can be interpreted as follows: ACL and Arbutus are the two fastest tools, also demonstrating no significant differences with regard to RAM size, and IDEA is in third place, followed by hfp (ref. fig. 37, fig 43, fig. 49). In the case of the latter two tools, differences are evident when using bigger working storage. A conjecture is that ACL and Arbutus perform their operations primarily on the disk, while hfp and IDEA perform them in the working storage (ref. fig. 49).
- In the SSD test runs, ACL and Arbutus are also the fastest tools, followed closely by IDEA. It is conspicuous that hfp leads with the 15 million rows big data set and is later overtaken by the other tools (ref. fig. 37, fig 43, fig. 49). Using a bigger working storage makes no big difference in the case of all tools.
- Once again, Arbutus is the only software that uses the second CPU core (mainly during the SSD test runs). ACL has a higher CPU workload while hfp rarely uses the processer. There are too little IDEA test results to make a qualified statement (ref. fig. 50).
- It is again noticeable that ACL and Arbutus again use all the limitated internal working storage range. Also, hfp has a consistently high RAM workload. Only IDEA has a noticeably low RAM workload (ref. fig. 51f.).
- ACL has high disk usage, especially with the SSD test runs. Arbutus, too, demonstrates strong disk usage. IDEA and hfp both use the disk with a lower read/write rate (ref. fig. 53f.).
5.5 Summarizing data
The test runs for the summarize operation will not be reviewed. Test results currently are not satisfying, hence additional research will be necessary.
6. Summary
Evaluating data analysis software tools according to their performance by stressing the software with huge amounts of data and different test algorithms, using different hardware configurations under comparable and repeatable system environments is a big challenge. Every single part of the testing environment had to be checked in order to create proper, valid, and replicable results.
Clear differences between specific data analysis tools when performing standard data query algorithms have been identified. Stressing the tools with a larger amount of data provides new insights: some tools could handle the data without greatly reduced performance, while other tools had significant problems performing some of the operations. The results have been accepted and reviewed by the software developers of this particular company.
This robust and flexible test environment that produces clean measurements and can easily be adapted to new requirements such as other software tools, extended data sets, and other hardware or operating system configurations.
It is planned to continue the software tests of data analysis tools. It is important to evaluate not only the technical performance. Human interaction with the tool is just as important.
7. References
[1] D. Weinberger, Too big to know: Rethinking knowledge now that the facts aren‘t the facts, experts are everywhere, and the smartest person in the room is the room. New York: Basic Books, 2011.
[2] K. Cukier, “Data, data everywhe,” The Economist,
2010.
[3] H. J. Will, “Computer-based auditing: Part I: Man-machine auditing,” vol. 100, pp. 29–34, 1972.
[4] G. Herde and A. Kohl, “Umfrage zur Akzeptanz der digitalen Prüfungsunterstützung: (‘Survey Report on the acceptance of digital audit support in Germany’),” in Compliance in digitaler Prüfung und Revision: Proceeding of the 7th Deggendorfer Forum of digital data analysis, Berlin: Erich Schmidt Verlag, pp. 69–83.
[5] J. Kaplan, AuditNet® Survey report on Data Analysis Software and Auditors. Available: https://www.surveymonkey.com/sr.aspx?sm=V00IhrwMsa6RfD
hex h3mJTuglcfIx3nBUYOblnLmJUc_3d.
[6] G. Herde and E. R. Töller, “Zukunftsorientierte Analysesoftware: Anforderungen und Parameter: (‚Future-oriented analytical software: Requirements and parameters‘),” in Compliance in digitaler Prüfung und Revision: Proceeding of the 7th Deggendorfer Forum of digital data analysis, Berlin: Erich Schmidt Verlag, pp. 85–103.
[7] J. Walkenbach, Excel 2013 bible. Indianapolis: Wiley, 2013.
[8] M. MacDonald, Access 2013: The missing manual, 1st ed. Sebastopol, CA: O‘Reilly, 2013.
[9] P. Tickner, How to be a successful frauditor: A practical guide to investigating fraud in the workplace for internal auditors and managers. Chichester: Wiley, 2010.
[10] H. H. Liu, Software performance and scalability: A quantitative approach. Hoboken, N.J.: John Wiley & Sons, 2009.
[11] C. Nagel, Evjen, B. Glynn, J, M. Skinner, and K. Watson, Professional C♯ 2008. Indianapolis, IN: Wiley Pub, 2008.
[12] H. Sibsanker, Inside SQLite: O’Reilly Media, 2007.

Prof. Dr. Georg Herde
Prof. Dr. Georg Herde ist Professor an der Technischen Hochschule in Deggendorf und dort im Studiengang Wirtschaftsinformatik tätig. Vor seiner Berufung an die THD promovierte er 1992 an der Universität Bamberg und arbeitete mehrere Jahre im Bereich der Wirtschaftsprüfung, Steuer- und Unternehmensberatung.
Schwerpunkt seiner Forschungstätigkeit liegt in der Datenanalyse betrieblicher Massendaten für die prüfenden Berufe (Wirtschaftsprüfer, Steuerberater, Betriebsprüfer, …). Er gründete das „Deggendorfer Forum zur digitalen Datenanalyse, das seit 2005 mehr als 16 Veranstaltungen im gesamten Bundesgebiet mit nationalen und internationalen Referenten durchführte. Insgesamt wurden bisher 11 Tagungsbände im Rahmen dieser Veranstaltungsreihe veröffentlicht.
Über dieses Thema publizierte er eine Reihe von Aufsätzen (vgl. https://pmit-ext.th-deg.de/publikationen/index.php?suche=Herde+Georg#ergebnis) und hielt Vorträge auf nationalen und internationalen Konferenzen, die ihn u.a. nach Japan, Kanada und zu einer Gastprofessur an der Chung-Cheng Universität in Taiwan geführt haben.
Prof. Dr. Georg Herde is a professor of business informatics at Deggendorf Institute of Technology (DIT). Before his appointment to DIT he was awarded a doctorate at Bamberg University in 1992 and was a professional in auditing, tax and management consultancy for several years.
His research focus lies in the analysis of business bulk data for the auditing profession (auditors, tax consultants, tax auditors…). He is the founder of the ‘Deggendorf Forum of Digital Data Analysis’ under the auspices of which more than 16 meetings have taken place throughout Germany since 2005, hosting national and international speakers. As many as 11 conference transcripts have been published ever since.
Prof. Dr. Herde has published a whole range of articles (please see https://pmit-ext.th-deg.de/publikationen/index.php?suche=Herde+Georg#ergebnis) on this subject and has presented numerous lectures at national and international conferences, taking him to Japan and Canada, amongst other countries. Moreover, he held a guest professorship at National Chung Cheng University in Taiwan.
Kontakt / Contact:
Dominik Fischer
Dominik Fischer studiert Data and Knowledge Engineering (M.Sc.) an der Universität Magdeburg. Zuvor absolvierte er eine Ausbildung zum Fachinformatiker für Anwendungsentwicklung und sammelte drei Jahre lang Erfahrungen in einer Internet-Agentur. Im Frühling 2015 schloss er an der TH Deggendorf das Studium der Wirtschaftsinformatik (B.Sc.) ab. Fischer hat zudem internationale Erfahrungen in Chile, Taiwan, Finnland und auf den Philippinen gewinnen können. Während seiner akademischen Ausbildung entwickelte sich sein Interesse an dem weiten Feld der Datenanalyse. Daher ist es naheliegend, dass er sich auch in seinen zukünftigen Forschungsarbeiten auf dieses Feld konzentrieren will.
Dominik Fischer studies Data and Knowledge Engineering (M.Sc.) at the University of Magdeburg. Before, he did an apprenticeship as a specialized software developer and gained three years of work experience in an internet agency. In spring 2015, he graduated in business informatics (B.Sc.) at Deggendorf Institute of Technology. Fischer has also gained international experience in Chile, Taiwan, Finland and the Philippines. During his studies he developed a strong interest in the wide field of data analysis, which makes it obvious that he wants to concentrate his future research work on this field.
Kontakt / Contact: