Engelbert Hofbauer
Technische Hochschule Deggendorf
Technologie Campus Teisnach
Manon Schilke
Technische Hochschule Deggendorf
Technologie Campus Teisnach
Jan-Peter Richters
Berliner Glas KGaA
Dept. Messtechnik Entwicklung
Rolf Rascher
Technische Hochschule Deggendorf
Technologie Campus Teisnach
Johannes Liebl
Technische Hochschule Deggendorf
Technologie Campus Teisnach
ABSTRACT
The vignetting field stop procedure uses a deflectometric approach to acquire big Optical Surfaces – DaOS – and it offers the possibility to measure nearly any shape or form using a scanning routine.
The basic physical measurement principle in DaOS is the vignettation of a quasi-parallel light beam emitted by an expanded light source in auto collimation arrangement with a reflecting element. Thereby nearly any curvature of the specimen, is measurable. Due to the fact, that even sign changes in the curvature can be detected, also aspheres and freeform surfaces of any size can be evaluated.
In this publication the vignetting field stop procedure is discussed. Additionally the deflectometric setup is described. Because of some typical influences of beam deflection to the accuracy of angle measurement by using the vignetting principle, suitable methods of calibration for the sensor are examined and the results of these methods are presented.
Furthermore, the technical principle of deflectometric measurements using an angle detecting device is explained inclusive of all random and systematic errors generated by the setup.
The last part of this publication shows the actual result of test measurements with calculated absolute deviation of errors with a large lateral dimension as well as the determination of the maximal achievable lateral resolution by detecting mid frequent structures on flat and spherical test parts with a diameter of 300 mm. These measurements are compared critically to reference results which are recorded by interferometry and further scanning methods.
Das Vignettierende Feldblenden-Verfahren bietet einen neuen, deflektometrischen Ansatz, um große optische Flächen mit nahezu jeglicher Form in einem einfachen Scanverfahren zu vermessen.
Das grundlegende physikalische Messprinzip in DaOS ist die Vignettierung der quasi-parallel von einer erweiterten Lichtquelle emittierten Strahlung, welche in Autokollimationsanordnung von einem reflektierenden Element zurückgestrahlt, abgeschattet auf einem Flächendetektor auftrifft und dort ausgewertet wird.
Damit ist nahezu jede Krümmung und auch ein Vorzeichenwechsel in der Krümmung des Prüflings messbar. Aufgrund dieser Tatsache lassen sich auch Asphären und Freiformflächen jeder Größe auswerten und rekonstruieren.
In dieser Veröffentlichung wird das Vignettierende Feldblenden-Verfahren kurz diskutiert und das deflektometrische Setup beschrieben. Einige typische Einflüsse der Strahlablenkung und geeignete Verfahren zur Kalibrierung des Sensors, welche die Genauigkeit der Winkelmessung beim Vignettierungsprinzip verbessern, werden untersucht und die Ergebnisse dieser Verfahren präsentiert.
Außerdem wird das Prinzip der deflektometrischen Anordnung mit Hilfe des winkelgebenden Sensors erläutert und die systematischen und zufälligen Fehlereinflüsse der Anordnung diskutiert.
Der letzte Teil dieser Publikation zeigt das tatsächliche Ergebnis von Testmessungen an Planflächen und Sphären bis 300 mm Durchmesser mit den berechneten absoluten Abweichungen der langwelligen Fehleranteile sowie die Bestimmung der maximal erreichbaren lateralen Auflösung an mittelfrequenten Strukturen.
Diese Ergebnisse werden mit Messungen interferometrischer Art sowie anderer Methoden verglichen.
KEYWORDS
Vignetting Field Stop Procedure, V-Spot, deflectometry, large optics, flats, spheres, aspheres, freeforms
Vignettierendes-Feldblenden-Verfahren, V-Spot, Deflektometrie, Großoptik, Planflächen, Sphären, Asphären, Freiformflächen
1. Introduction
In the field of precision optics mostly interferometry is used to determine shape errors of spherical or flat surfaces, but especially for large convex optics or aspheres, its functionality is strongly limited. For the deflectometric determination of any optical part using an autocollimator, the collimated beam is deflected through an invariant mirror system to the surface. The main advantage of the procedure is that no large and expensive references are necessary so the systematical error, especially with large optics can be reduced dramatically.
Instead of a sharp picture, a mathematically clearly describable, defocused light spot is determined. The following image processing method calculates the value of the lateral offset corresponding to the angle of reflected beam.
2. New Measurement Principle
2.1 Deflectometric Flatness Reference DFR for flat surfaces
The principle of DFR is well known by using a scanning pentaprism [1] or penta mirror. Because of two internal reflections at the penta system, the deflected light bundle is invariant to angle deviations along the direction parallel to the Y-Axis –see figure 1. Roll angle errors influence the deflecting light in second order of roll angle. This works very well at flat surfaces up to the Sub-Nanometer scale [2,3].
The problem however is the measurement on strongly curved optical surfaces like spheres, aspheres or freeforms with slope changes larger than for example ± 1000 arcsec. The additional effect of vignetting by the classical autocollimator with crosshair or structure fixed in the object field as a point e.g. on the optical axis is not successful for such measurement, because reflected beams do not fit the aperture of the optic of the autocollimator. Therefore, this principle is limited by angle range and distance of light in optical path as shown in figure 1 in the right.
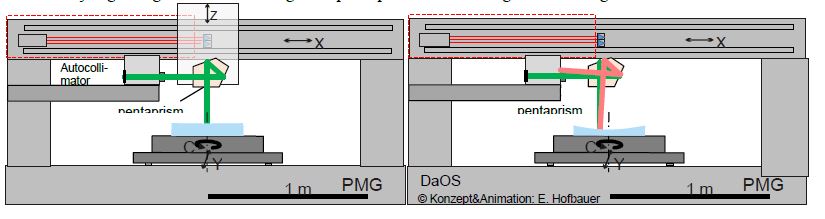
Figure 1. Setup of DFR on Precision Measurement Granite portal PMG. The emitted beam (green) from center of crosshair is reflected on Surface under Test SUT. For flat and smooth curves samples (radius in km-range), beam is reflected to the optics of autocollimator (left). In the case of higher curved surfaces with smaller radius (in m-range) reflected light cannot be detected because of failing the aperture of the optics (right).
2.2 Deflectometric acquisition of Optical Surfaces DaOS for large curved surfaces
Combining the Deflectometric Flatness Reference with Vignetting Field Stop procedure [4] VSP, we come to the Deflectometric acquisition of Optical Surface DaOS. Therefor another data acquisition system is necessary. The Vignetting Field Stop or so called V-SPOT Procedure [4,5,6] is able to solve the problems of the classical autocollimator and gives further innovative solutions and options.
2.2.1 Vignetting Field Stop Procedure VFS
The Vignetting Field Stop VFS or so called V-Spot procedure is an special autocollimation principle using vignetting of the small aperture of the collimating optics. Instead of a fixed crosshair in object filed on the optical axis at the classical autocollimator, the larger emitting area allows varying the path of light, corresponding to perpendicularity of surface at specimen under test and illuminating of full entrance pupil. Figure 2 shows the setup of an autocollimation system with illumination and detecting area. The illumination area shows only 5 points in a meridional section of the setup. While failing the aperture of optics for the fixed light emitting point on the optical axis in case of tilted mirror (right side) light from the adjacent point (green rays) is reflected on the tilted mirror in retroreflection (rays are perpendicular to SUT) and is imaged on detector in the sensor system by nearly full intensity.
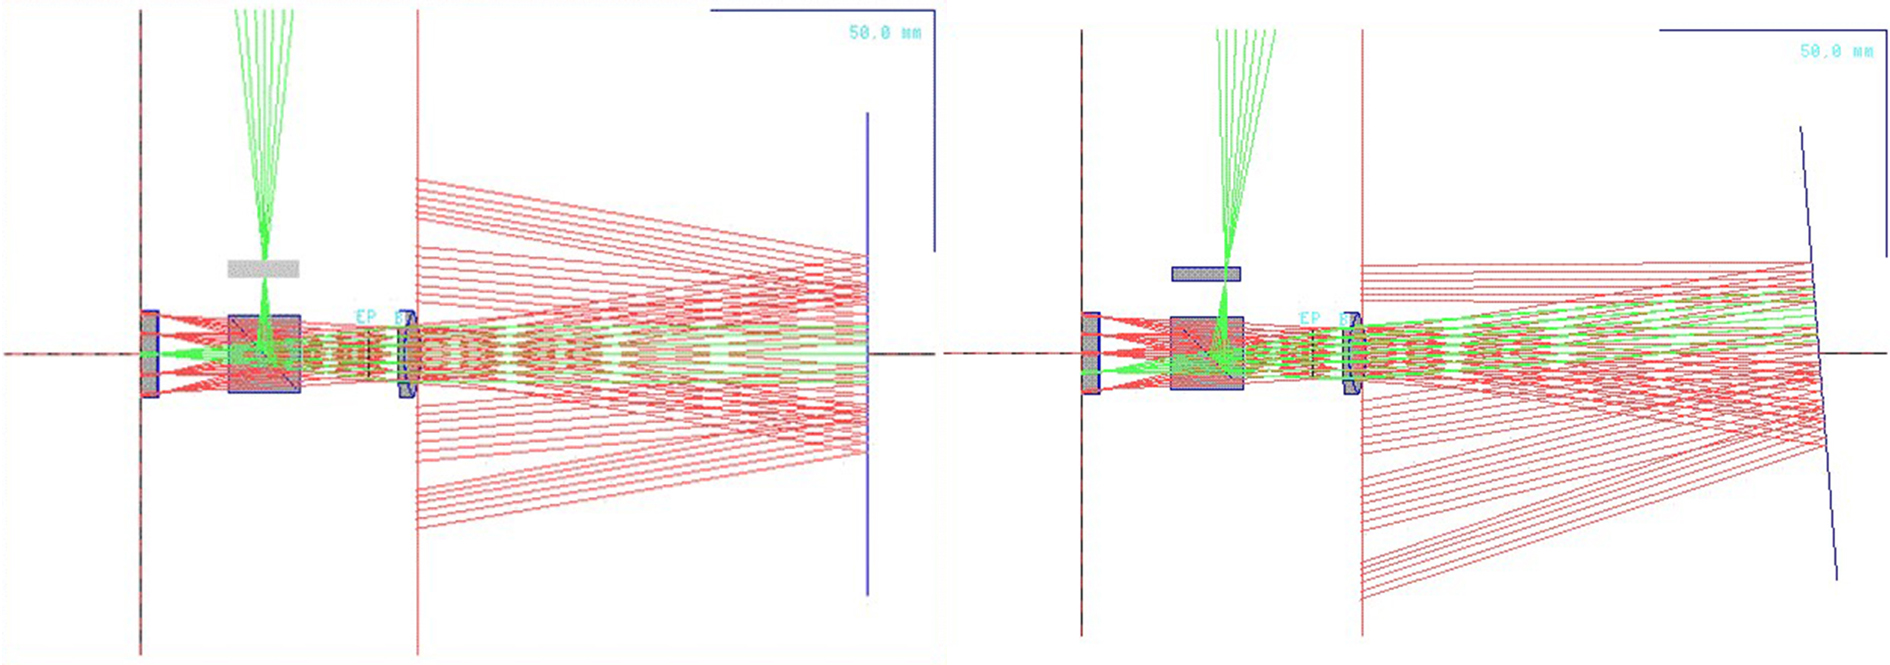
Figure 2: Setup of autocollimation system with illumination (only 5 from infinity points are shown) and detecting area. The rays that are perpendicular to reflector surface (green) are completely reflected back to system and give full illuminance in image plane.
Fig. 3. shows the image on a ½”-CCD-Sensor using a focal length of 140 mm with F# 5 at mirror distance of 500 (left) and 2000 mm (right).
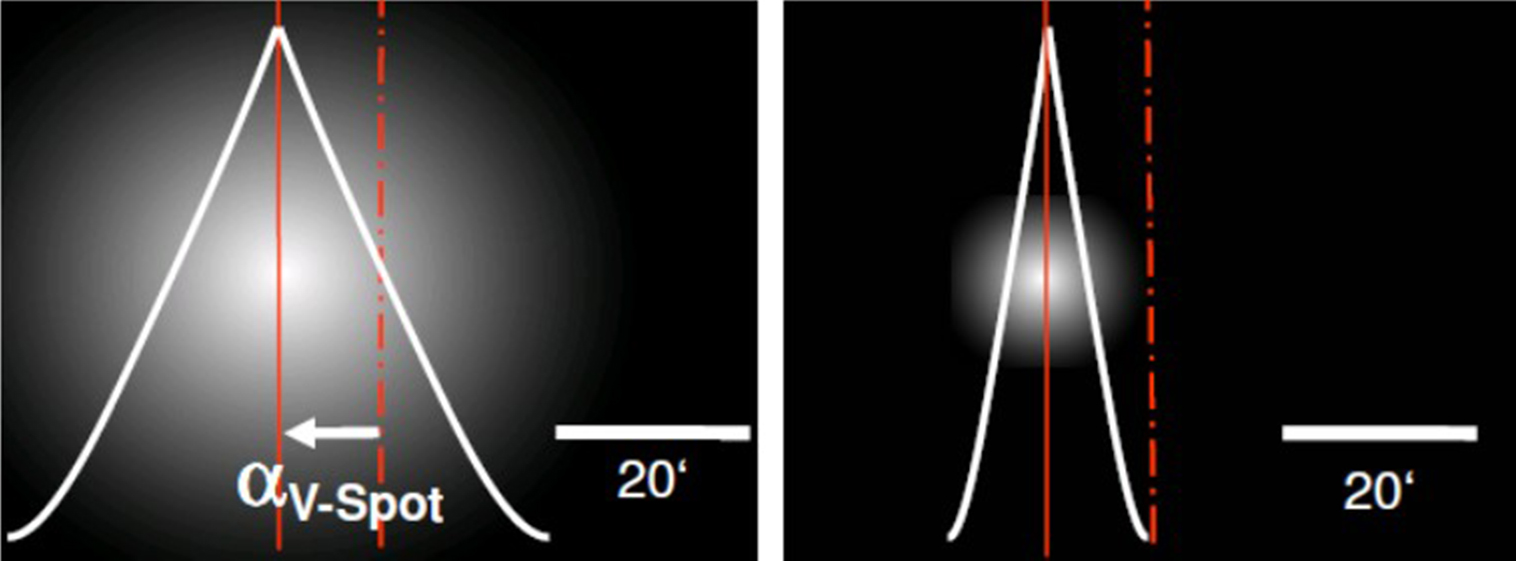
Figure 3: Image and Intensity distribution on an image sensor with 1/2“ CCD-camera and focal length f‘ = 140/F#5
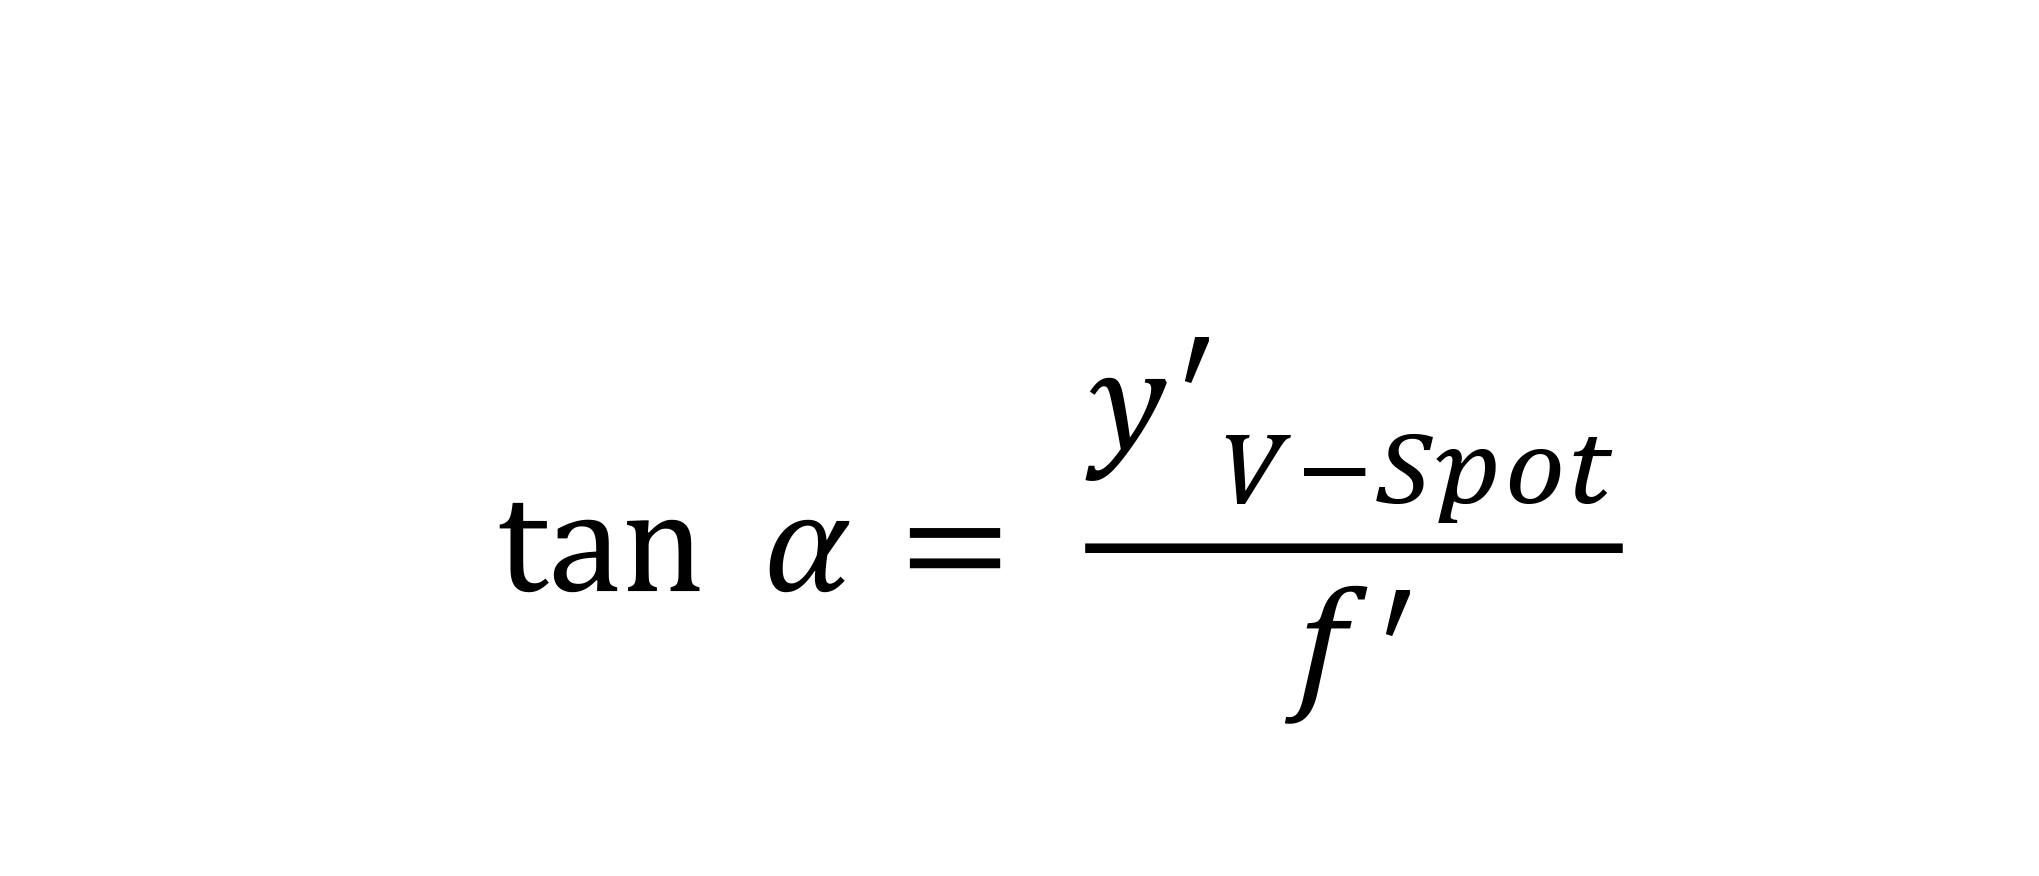
The image height y’ is proportional double time to mirror angle α by the classical autocollimation setup known as
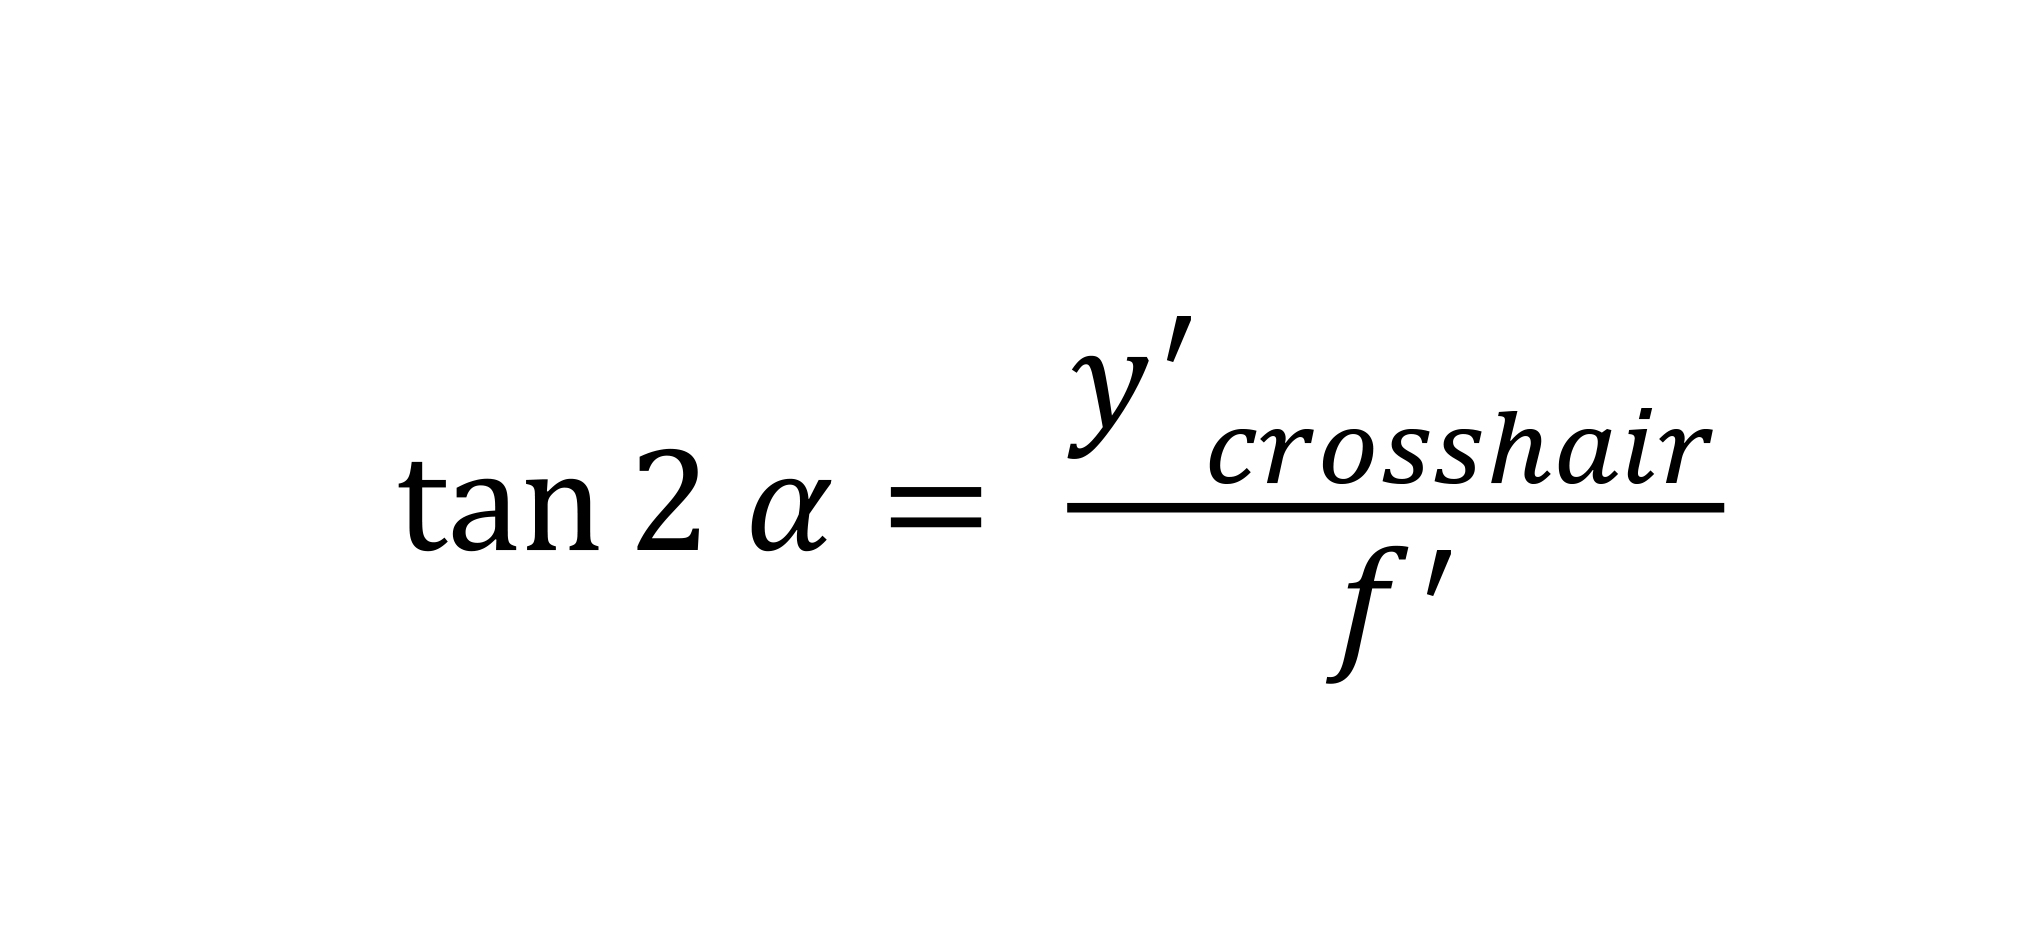
This means that the direct image of the crosshair is two time “faster” or two times larger than the pupil image which relates to one time of mirror tilt by
This also means that the measurement range of equivalent sensors (same camera format and focal length) is two times larger at the Vignetting Field Stop VFS Sensor.
In practice, a focal length of 46 mm at F#5 with 1,2 MP-camera-format of about ½” is used. The physical resolution for movement detection in lateral displacement for the single binary V-SPOT detection is given by [7]
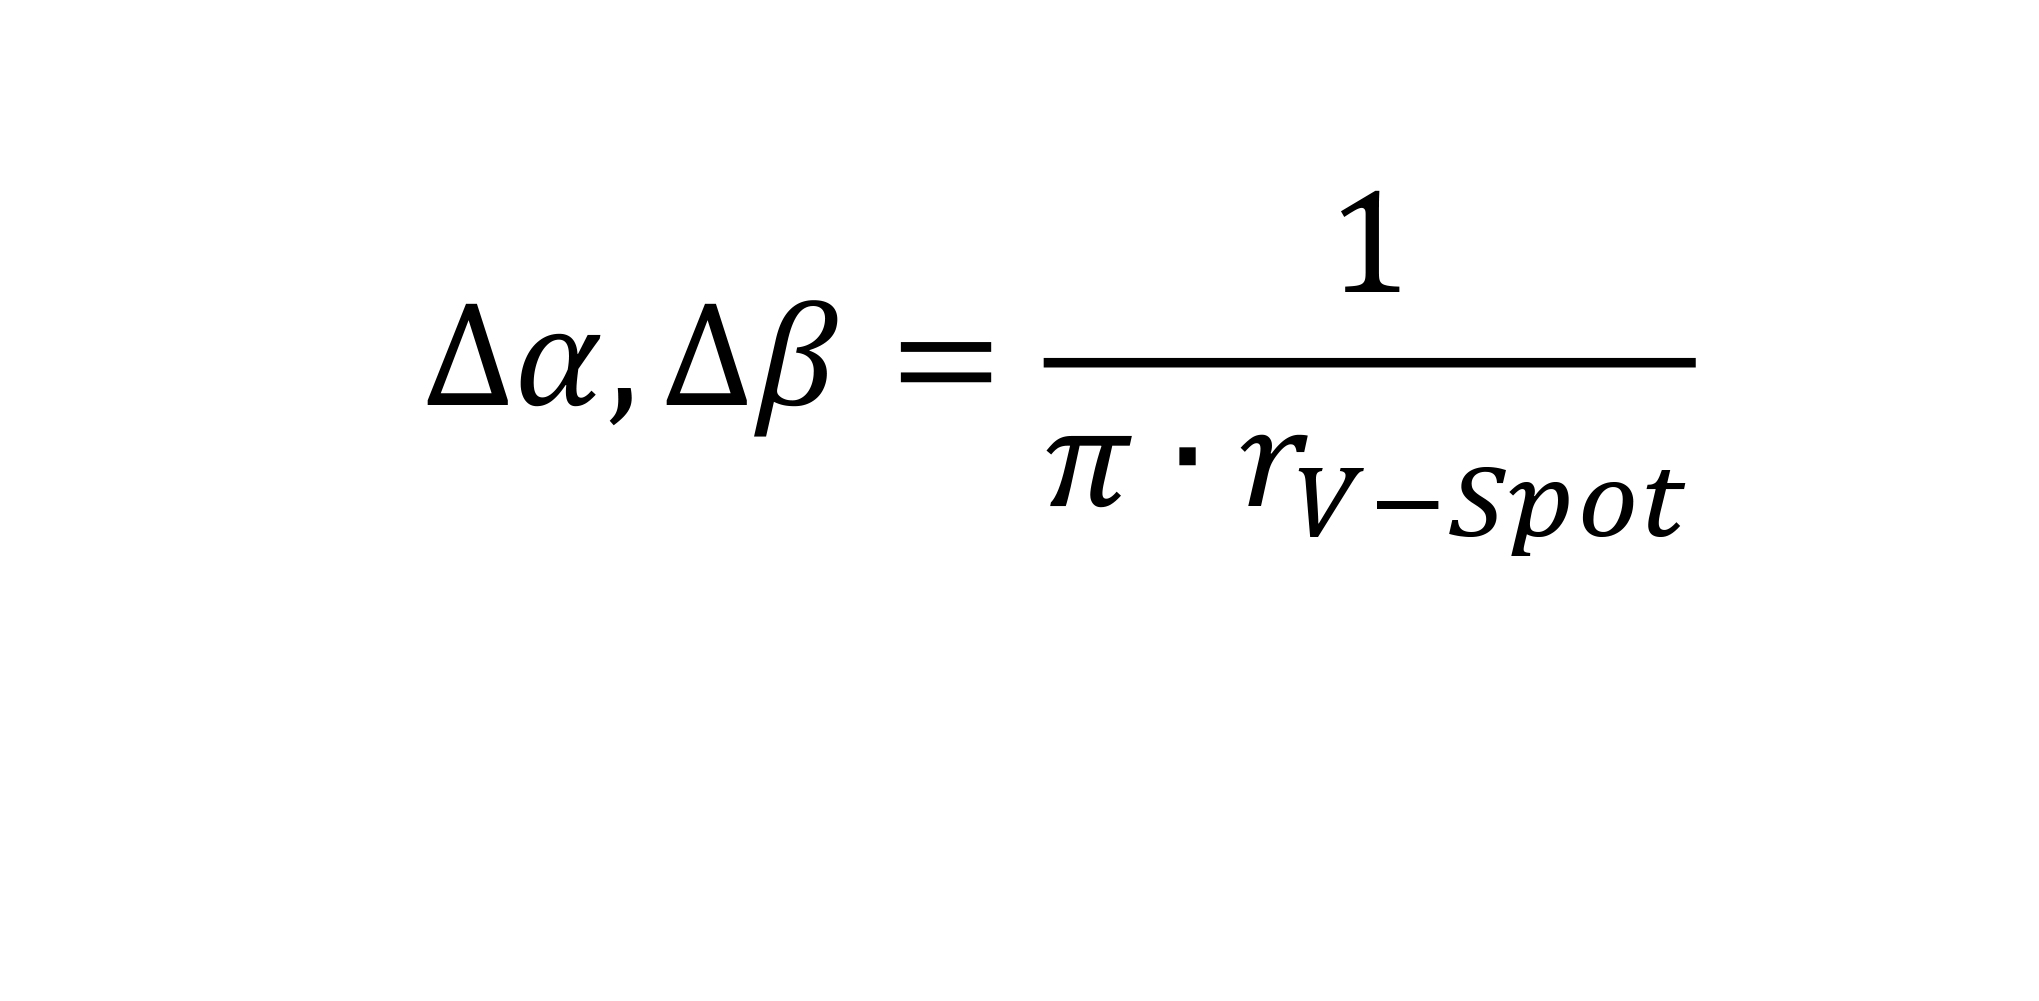
with rV-SPOT is the radius of the binarised BLOB.
Even for a non-binarised V-SPOT the resolution will increase. Further research will be done and published in near future, to evaluate this limits. The accuracy over the range of ± 2,8° as shown in figure 4 is < 0,001° (3,6 arcsec) with an average rms-value of < 0,00045° (1,6 arcsec) over a mirror distance range from 300 to 2.400 mm. As also seen in fig. 4 there is a limitation for linearity caused by the two dimensional calibration setup [6] whith PImiCos PRS-110 equipment.
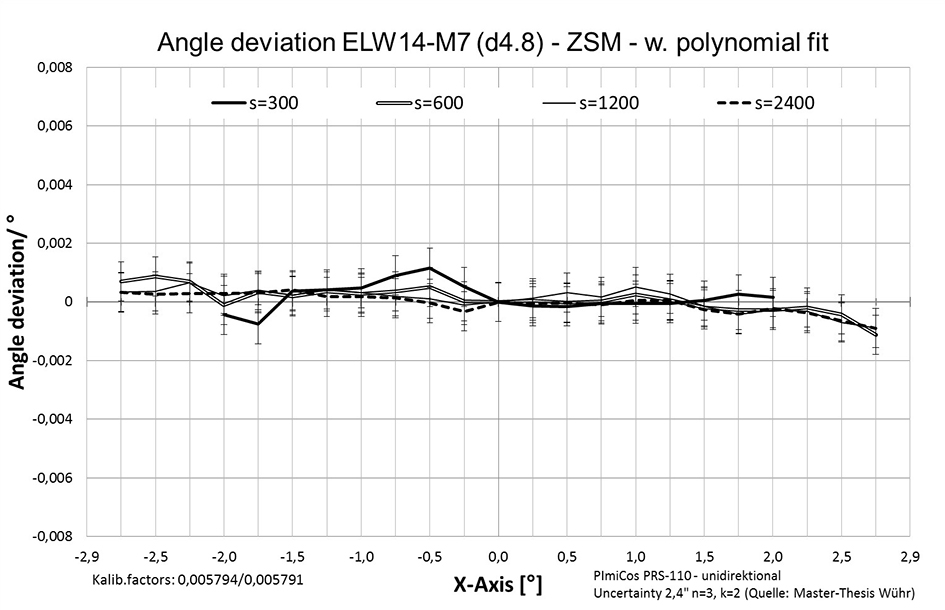
Figure 4: Result of the WiPoVi-Sensor calibration over a measurement range of ± 2.8 degrees at several distances from 300 to 2400mm. Error bars correspond to the uncertainty (k = 2, 1-α = 95%) of the angular reference table PImiCos PRS-110.
2.2.2 Deflectometric acquisition of Optical Surfaces DaOS with VFS
In order to detect also reflected light from the
edge, VFS Sensor with angular measurement range up to slope on the edge, measurements can be done as seen in figure 5.
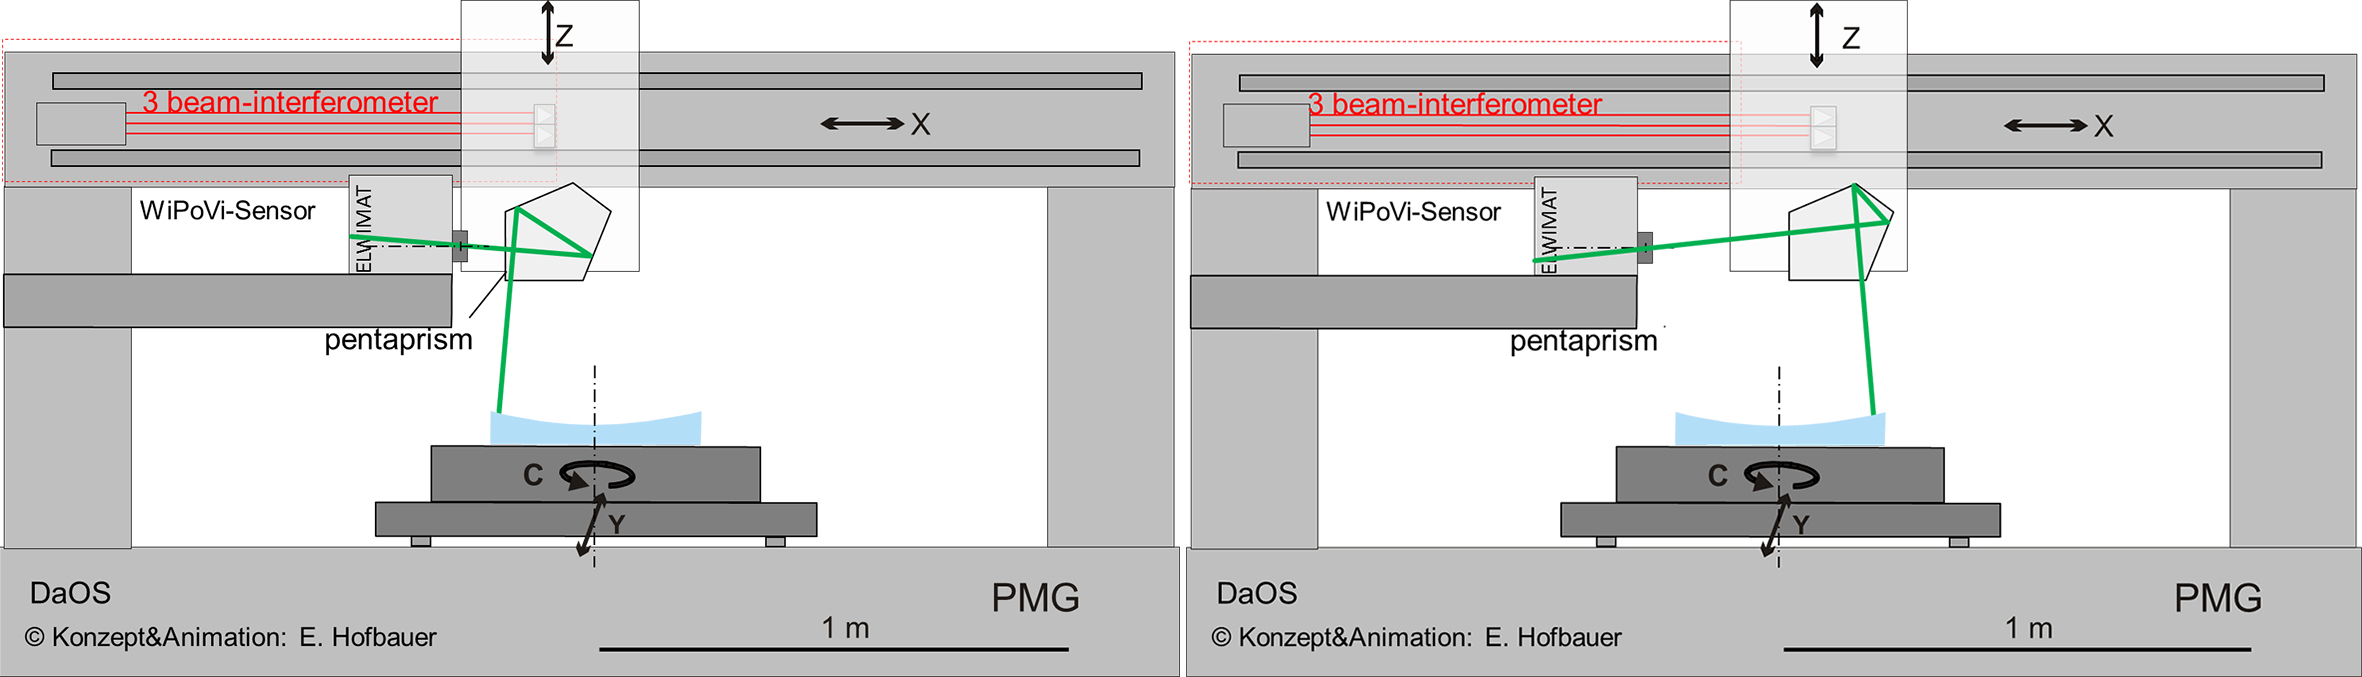
Figure 5. Setup of DaOS on Precision Measurement Granite portal PMG at Deggendorf Institute of Technology, shown in two edge positions. One of the emitted beam within the measurement range will always be perpendicular to the surface under Test SUT, and therefore will be reflected directly back to the sensor and will fit the aperture of the optics of the V-SPOT-Sensor.
2.2.3 Reconstruction of optical surface by line scan methods
In order to reconstruct the surface of a mirror substrate, several radial sections will be measured, using scans at azimuthal directions (e.g. 0°, 45° 90° and 135°, figure 6). The more scans, the better reconstruction will follow. The best strategy considering time, temperature variation and reconstruction accuracy will be find out in next time on our project DoSuRe. In addition to these radial sections, measurement in one or more circular sections are necessary to get correct reconstruction including all informations about aberrations of 3rd and higher order like Coma, Trefoil and others.
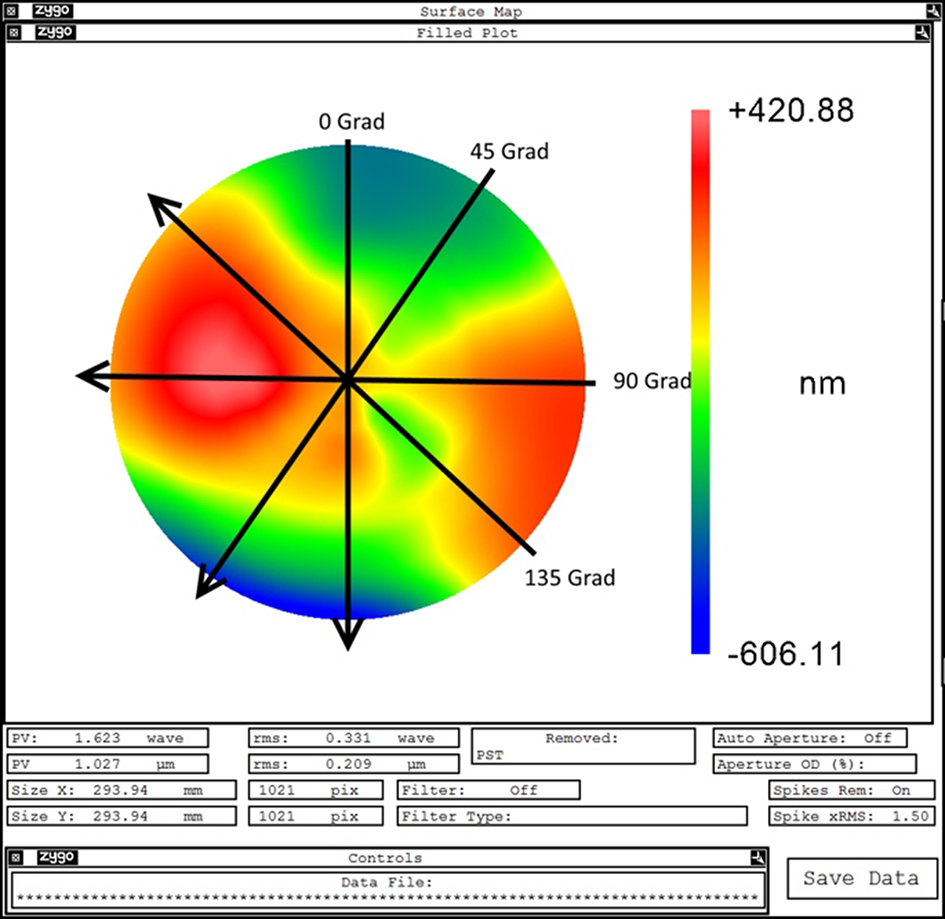
Figure 6. Lines and optional ringsegments of future DaOS-Surface evaluation of large optics
To reconstruct the complete surface out of the small amounts of data points of the measured traces along the surface several approaches were created and due to a program routine in our laboratory the measured traces along the surface were converted in mod-format. This file type is used for stitching the complete surface out of the measured datasets with the analysis unit of a TAYLOR HOBSON® measurement system. The results were saved as xyz-files to enable an alignment of the pv, rms- and power-values with the analysis software MetroPro®.
For our own approach the development environment MATLAB® is used. The main part of all developed analysis algorithms is the use of a Zernike Polynomial Expansion.
At least three algorithms are used to reconstruct the surface topography. One of them was created from Dr. Richters at the company Berliner Glas. Here, the aligned scans are linearly interpolated in polar coordinates and then rasterized linearly to xyz and native Zygo MetroPro binary-format for easier comparison using MetroPro®. The others were developed on the Technologie Campus Teisnach. In figure 7 the current results of an evaluation with the analysis software MetroPro® are shown. The measured datasets are recorded by the ELWIMAT_AKF 46-4,8#17.
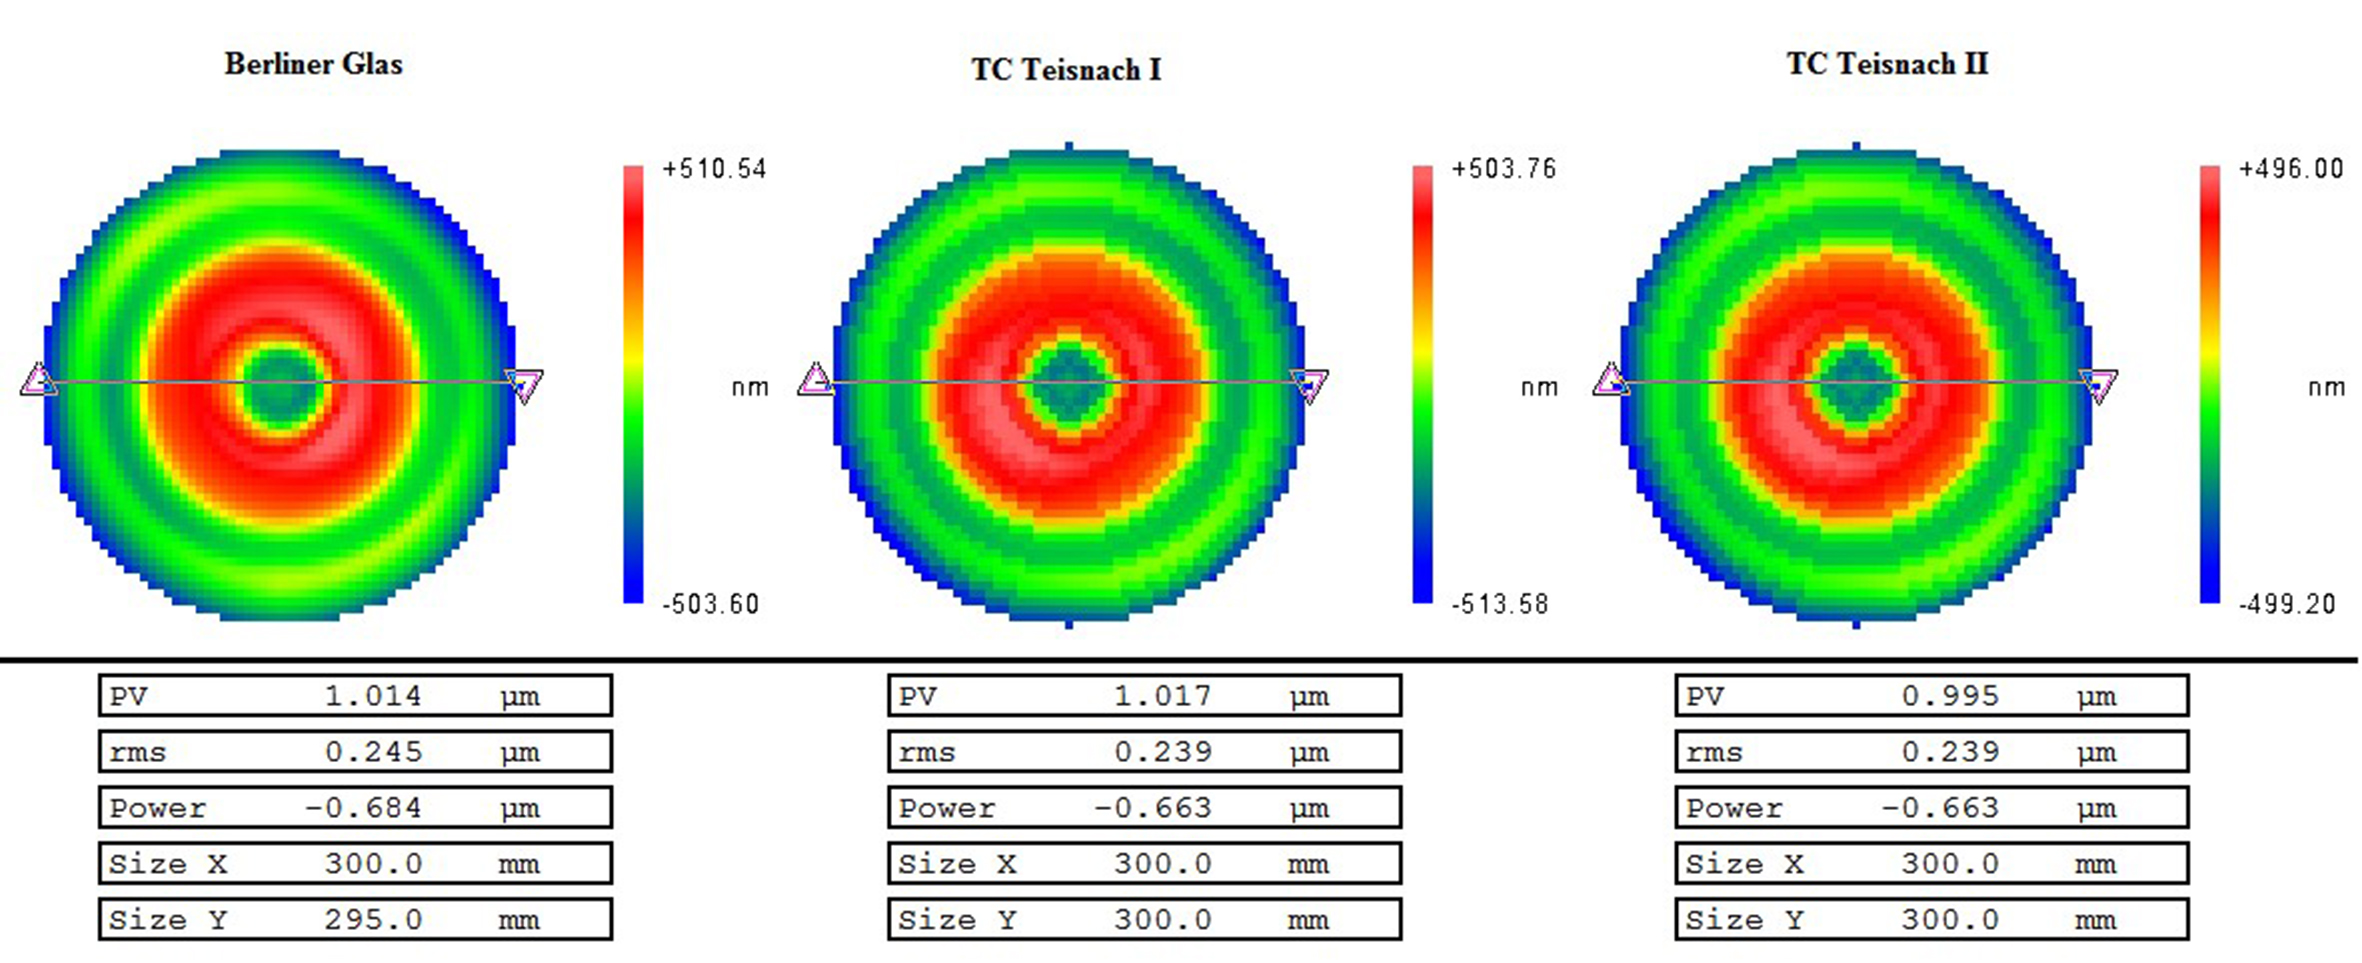
Figure 7: Alignment of the results of three developed evaluation algorithms in the analysis software MetroPro®.
The result shows maximum deviations in PV and power within 19 nm and 21 nm. The rms value differs at maximum 6 nm. With these first results, further investigations for the optimization of the algorithms are in progress in the following project DoSuRe. It is also seen that the simple and strong symmetric approximation and interpolation does not fit very well with interferometric and line scan measurements of DFR and DaOS. Further tests and theoretical simulations will follow.
3. Measurement Results
3.1 First results with single line scan
Very first results as shown in SPIE Proceedings [6,7] are done with the Sensor ELWIMAT 45-46 SN.#14, a Sensor with focal lenght of 46 mm by F# 4,8 and results of measuring linearity described in capture 2.2.1.
Sample one, a mirror with a smooth radius R = 20 m, Ø300 mm, coated with aluminum has been measured according DaOS with this sensor.
The result is shown in figure 8. The maximum slope at the edge belongs to 6,8 mrad (0.389°).
3.1.1 Radius evaluation with absolute accuracy
The sagitta height of 441,3 μm with an evaluated and calculated uncertainty of ± 0,5 μm at the measured diameter of 270 mm ± 0,7 mm enables to calculate the radius of curvature of 20.280 mm with uncertainty of 140 mm (k=2). This means a relative error of radius of 0,69% and a SAG error according to ISO 10110-5 of about 11 fringes (3/ 11 (-,-).
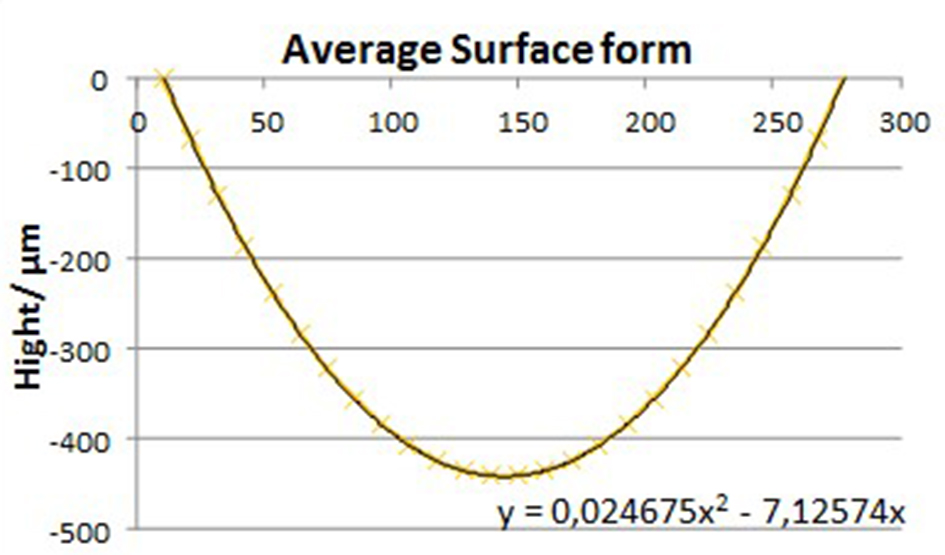
Figure 8. Average result of surface form deviation on mirror with radius 20 m.
3.1.2 Error budget at DaOS line scan
There are some influences in measurement errors which has to be considered and eliminated or reduced to get highest accuracy better than λ/10 @633nm. On the one hand there are systematic errors like geometrical deviations, penta prism adjustment and wavefront aberrations, linearity and also distance depending linearity effects of V-Spot sensor. On the other hand several random errors like temperature variations in measurement environment and on DUT, vibrations and air turbulences, random errors of sensor signal processing (signal-noise ratio) non reproducible roll angel and others may disturb the measurement.
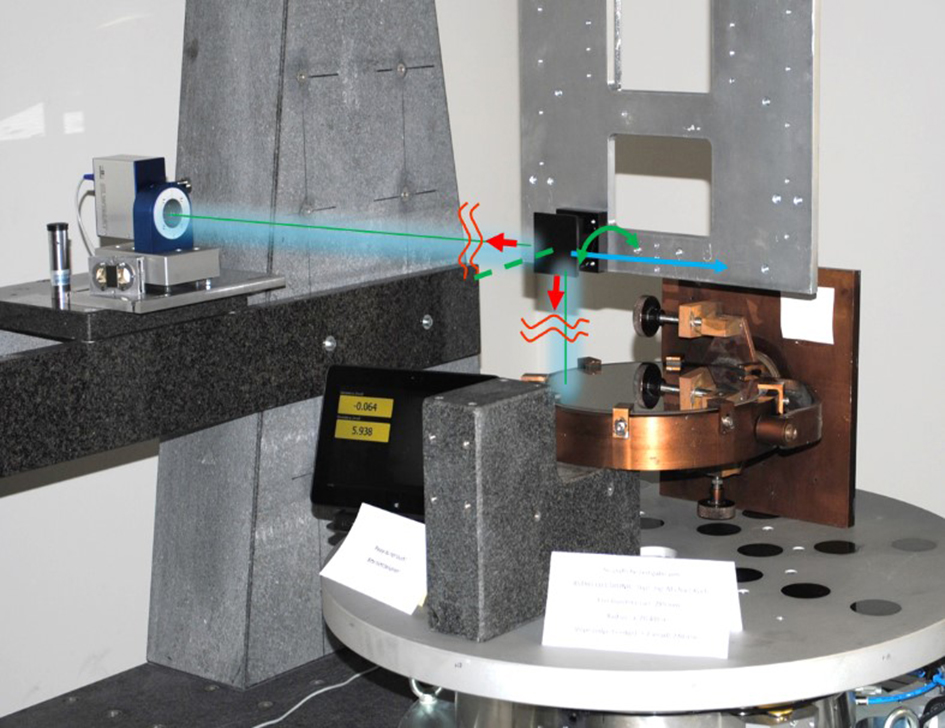
Figure 9: Measurement setup DaOS with radius 20 m mirror and some errors influences
Table 1: Error budget fpr the actual single line scan measurement setup at PMG with sample diameter 300 mm and step distance of 10 mm.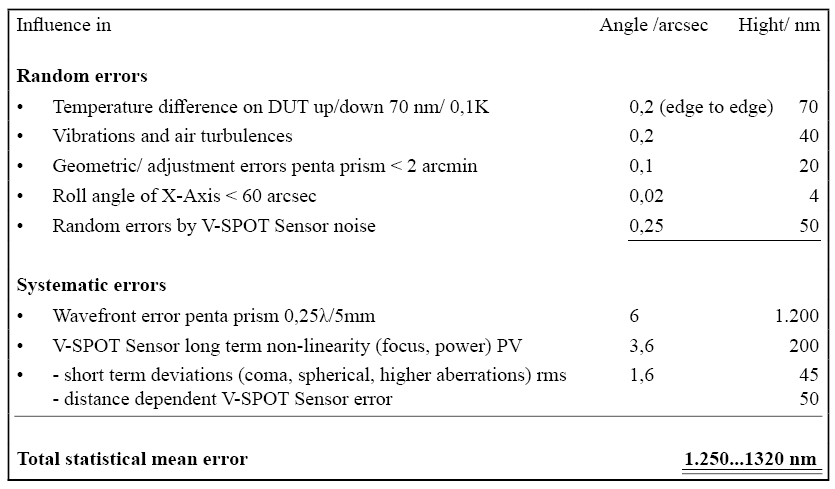
The greatest influences are seen in table 1 and are of systematic characteristic. First the wavefront error of penta prism with about 1200 nm (inhomogeneity of glass), second the long term sensor errors by non-linearity and third the distance dependent V-SPOT-Sensor error. To eliminate and evaluate this systematic influences, a reversal measurement is done measuring in direction forward and backwards with 180°-turned sample. The result seen in figure 10 shows a Peak to Valley at 410 nm (0,65 λ @633) and the rms about 112 nm (λ/6 @633).
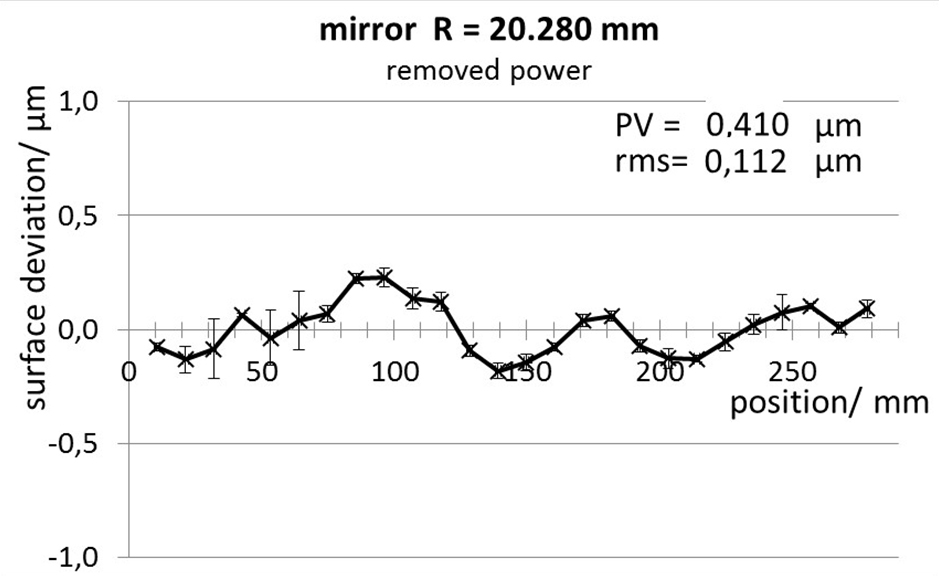
Figure 10: Surface deviation of mirror R 20.280 mm after correction of systematical errors by reversal measurement.
Compared with the first measurements described in SPIE-Proceeding 9132 913206 [6], without reversal measurement the deviation of about ± 1,5 micrometer (PV = 3 μm) is seen. This meets very exactly our consideration of above mentioned error budget.
3.2 Validation with a „Plano-Double-Sombrero“
In order to validate the measurement principle of new DaOS, a special “plano aspheric” geometry with “double sombrero” on a 300 mm diameter substrate was created (fig. 11) and measured by a short round robin test. R = plan; Ø = 308 mm, Thickness = 50 mm Øe = 300mm/ 294mm.
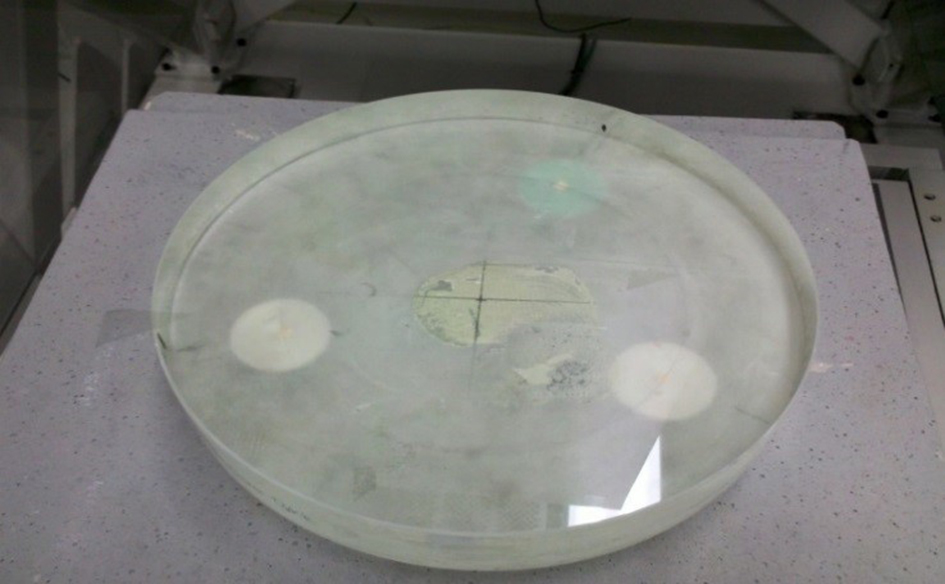
Figure 11: Plano-double sombrero with diameter 300 and thickness of 50 mm. Right: Crosscut in X- and Y-direction.
We used interferometry at the one hand and DFR in the other hand for evaluation. For Interferometry measurements a QED SSI-A instrument with a 4”-TF and a 6”-TF (both calibrated with tree flat test at TC Teisnach. Another evaluation is given by a 12”-Fizeau–Interferometer from ZYGO-Corp. in vertical position at cooperating company Berliner Glas.
The DFR setup at PMG in Teisnach were done with three different classical electronic autocollimators:
- ELCOMAT 2000 (f=300)
- Trioptics Triangle (f=500)
- ELWIMAT_AKF 46/40 (f=46)
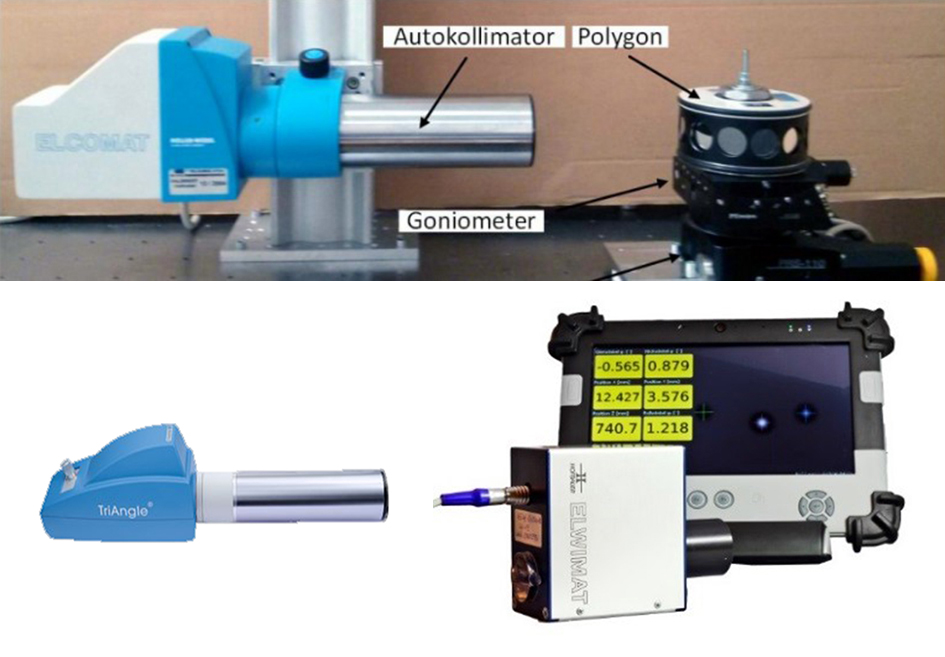
Figure 12: Instruments of electronic autocollimators for measurements DFR
At last measurements are done with the Vignetting V-SPOT Sensor ELWIMAT 45-46 #19 in order to evaluate this system in an absolute and reproducible way and also to evaluate measurement resolution in mid frequency structures to validate also coma and aberrations of higher order at polynomial function up to the 8th or 10th order.
3.2.1 Reference measurements with Interferometry
First we measured the plano-double-sombrero at SSI-A with 4”-TF transmission flat, which was calibrated using the tree flat test in 2012. Second and after some deviations on DFR measurements we made a three flat test on 4”-TF and also at a 6”-TF. Figure 13 shows the result of the 12”-Interferometer measurement at Berliner Glas and Table 2 includes the summarized PV, rms and SAG error (power) for all interferometric measurements.
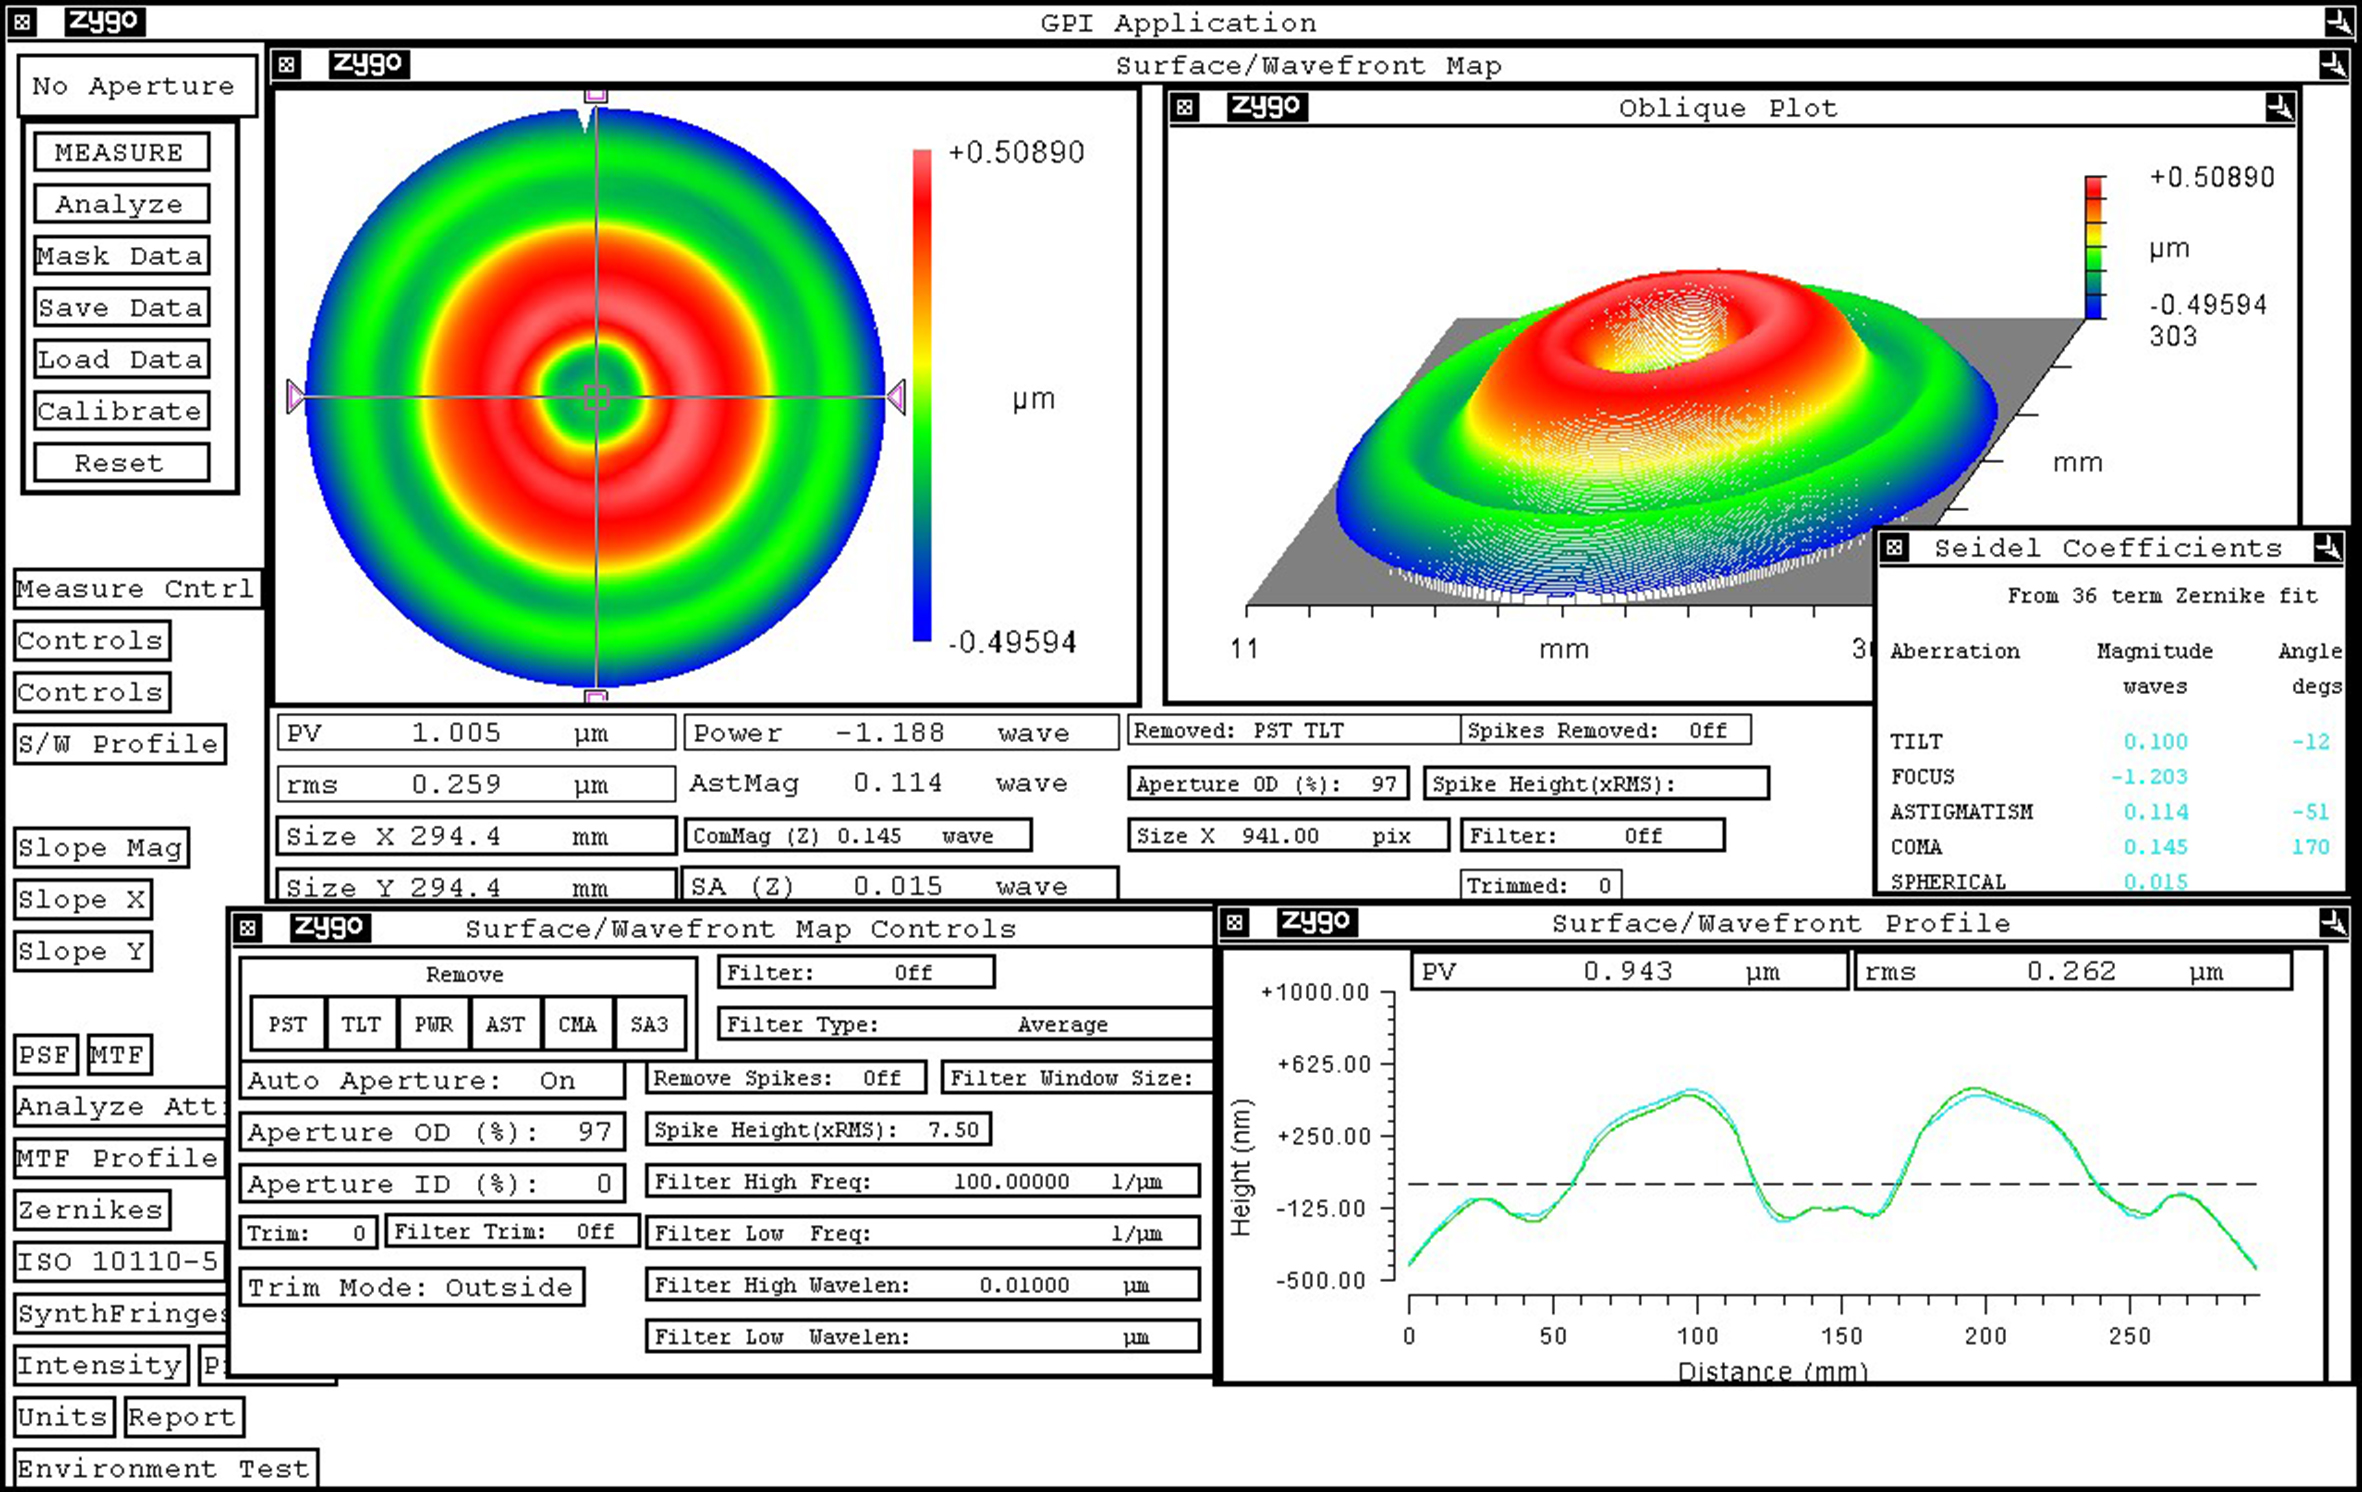
Figure 13: Interferometric measurement at plano-double sombrero, diameter 300, thickness 50 mm with 12” at Berliner Glas.
Table 2: Results in interferometric measurements of the „plano-double-sombrero“ with Interferometric methods
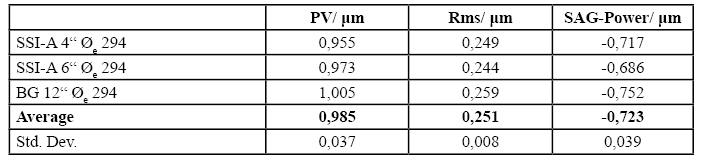
The results shown in Table 2 offers an average PV-Value of 985 nm with a maximum deviation of 50 nm at all three measurements in two different laboratories and two different interferometer types. The absolute deviation of 3D-fitted power (SAG-error) is at maximum 66 nm. The standard deviation of the average of the three measurement results is 39 nm. The larger deviation of power at instrument at instrument at Berliner Glas is a gravity induced effect because due to the vertical orientation the transmission reference flat shows deformation of about 50 nm in the power term.
3.2.2 DFR-Measurement with electronic autocollimators
The deflectometric measurements with classical electronic autocollimators with crosshair were done in 4 sections at 0°, 45°, 90° and 135 degrees. A stop was applied near to the surface under test with an area of 14 x 20 mm for ELCOMAT 2000 by step 10 mm and diameter 5 mm for TriOptics 500mm and ELWIMAT_AKF 46 mm by step 5 mm. The measured scans are used to reconstruct the surface, feeding to software Taylor Hobson® for the ELCOMAT 2000 and the TCT-Algorithm with the other both autocollimators. The final results in PV, rms and power are seen in table 3.
Table 3: Results in DFR measurements of the „plan-double-sombrero“ with electronic autocollimator
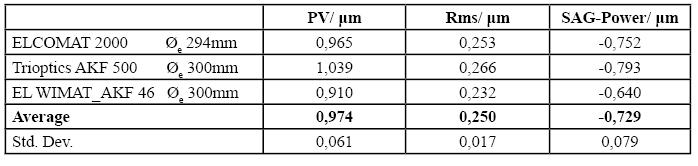
Significantly we can see the PV-values which corresponds strongly with the influence of power in table 2 and 3, the quadratic term in the measured function. Varying the PV-value and power up to 129 nm and 153 nm, about three times more than at the interferometric measurements, we have to consider the influences at physical effects:
- Thermal drift of instrument holder during measurement
- Varying temperature difference of lower and upper side of specimen (table 1)
- Different sensitivity of instrument e.g. proportionality factor
- Linearity error of AKF and V-SPOT-instruments (table 1)
First we have to realise, that our environmental surroundings at PMG are not perfect because temperature compensation with about ± 0,5…1 K is not as good as in our laboratory (± 0,1 … 0,2 K).
Second, our “double sombrero” substrate is not quartz or ZERODUR® but probably Pyrex or similar material with a higher temperature expansion coefficient of about α = 3…4 E-6 1/K. This material is not the best choice, for high precision measurement of spherical influence (radius, power, SAG). In the case of pyrex we have calculated the influence of temperature gradient (upper to lower side of substrate) to vary by 70 nm per 0,1 K. Changing at the gradient up to 0,2 K, the Power or SAG error will rise up to 150 nm. In order to have no influence of algorithmic effects due to 3D reconstruction, we reduce data analysis to one dimensional 2D measurements for line scan as seen in figure 14. The spherical term is shown additional for two of the interferometric and the three autocollimation DFR measurements.
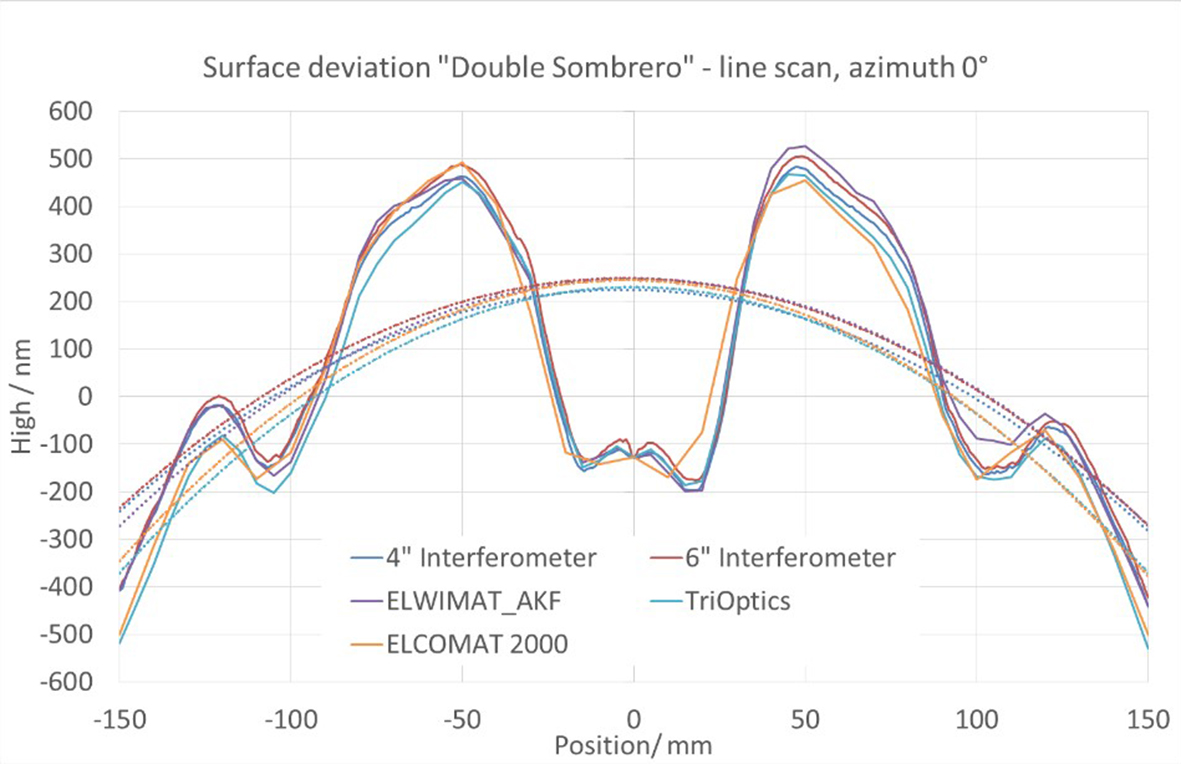
Figure 14: Interferometric and DFR measurements of plano-double-sombrero at azimuth 0°.
The graph in figure 14 shows the original measurements of interferometric and deflectometric DFR measurements in the azimuth direction of 0 degree. There is a good qualitative agreement at the characteristics of curvature of the structure of so called “double sombrero”. But there is also seen, that the Deflectometric measurements varies strongly in the sagitta hight. The SAG errors (power) differs by about 150 nm, this is also seen in table 3. As also seen in figure 14, there are some decentering effects and the resolution varies between 10 mm (ELCOMAT 2000), 5 mm (ELWIMAT_AKF, Trioptics) and 0,89 mm for interferometric results.
In order to eliminate this temperature effects SAG error will be substracted from each measurement to get the Irregularity error. In figure 15 the average surface measurement of the two SSI-A interferometric measurements and the average of all three autocollimators is seen.
In order to compare the data and calculate the differencies of curves, the smaller amount of data in DFR and the following DaOS measurements by V-SPOT Sensor will be interpolated.
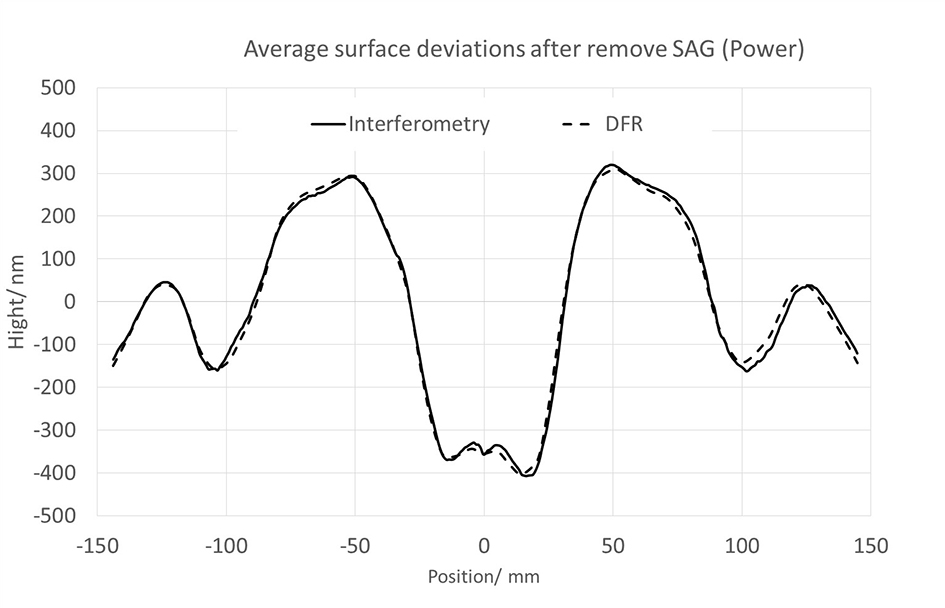
Figure 15: Averages of Interferometric and auto collimator DFR measurements at azimuth 0° after removing SAG error.
4. DaOS-Measurements on double sombrero with V-SPOT-Sensor
In order to evaluate the new V-SPOT-Sensor we use a ELWIMAT 46-4,8 UI1542#19 with focal length of 46 mm at F#4,8. Measurements are done in line scans at 0 degree of plane double sombrero.
4.1 Reverse measurement to reduce systematic influences
Most of the systematic errors like penta prism wavefront error and distance dependence error of the whole setup of DaOS are eliminated by reversal measurement.
The influence of these systematic errors as difference of the reverse measurements is shown in fig. 16. The value reaches a pv-value of 110 nm with an rms of 22 nm.
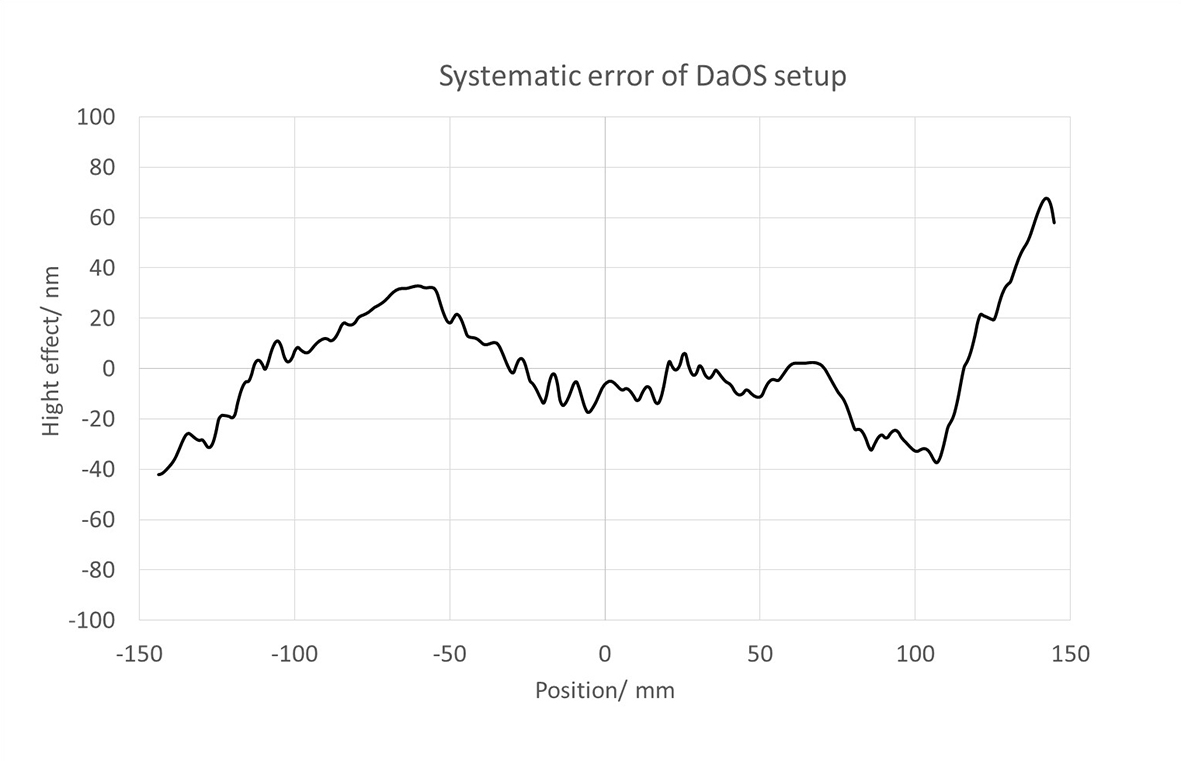
Figure 16: Evaluated systematic error of penta prism and V-SPOT sensor ELWIMAT 46-4,8 #19 by reverse measurement.
4.2 Validation of irregularity IRR after reducing SAG error (power)
To get elimination of above described effects we compensate the SAG error (power) at all measurements in order to reduce the influence of temperature effects during measurements and compare the results by viewing the so called irregularity IRR corresponding to the DIN-ISO 10110-5. The measurements were done by the modified and contrast enhanced V-SPOT Sensor ELWIMAT 46-4,8#19 in order to validate also non coated substrates with small reflectivity. With higher signal noise ratio we will be able to measure also at small aperture stops (scanning beam diameter) up to 1...2 mm or smaller.
The measuring result of DaOS with V-SPOT-Sensor is seen in figure 17. The table shows the very good agreement of all three measurement types including interferometry, DFR with auto collimator and DaOS with the Vignetting V-SPOT Sensor.
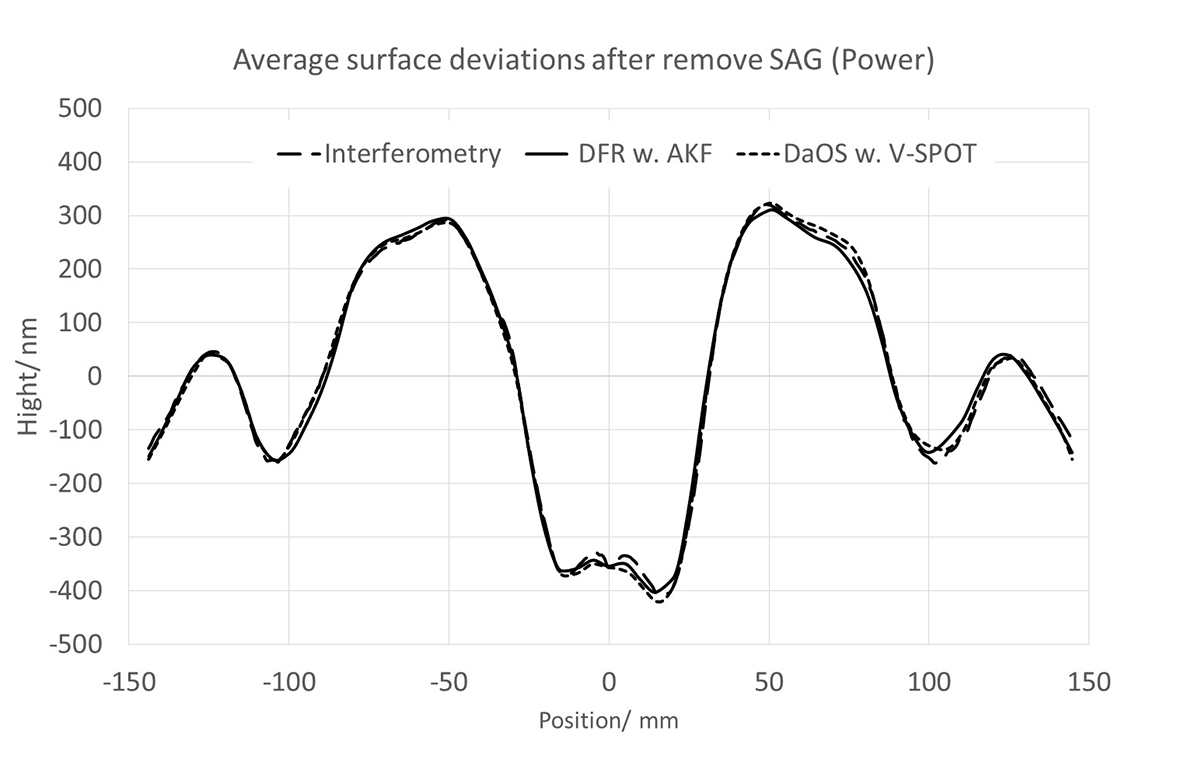
Figure 17: Interferometric, DFR- and DaOS- measurements of plan-double sombrero at azimuth 0°.
Table 4: Results in irregularity IRR (DIN ISO 10110-5) after removal of spherical part for all types of measurements at the „plane double sombrero“
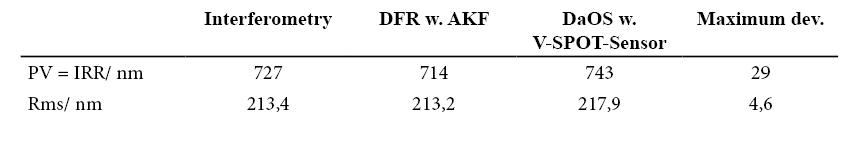
As described in Chapter 3.2.2, by interpolating of measurement data, we are able to take the residual curves of the measurements for an direct comparison. Therefore we take the difference of averaged DFR direct to interferometry and also DaOS to interferometry. The result shows, that there are residual errors of about pv 69 nm/ rms 14,5 nm at DFR with AKF and pv 63 nm/ rms 11,5 at DaOS with V-SPOT Sensor.
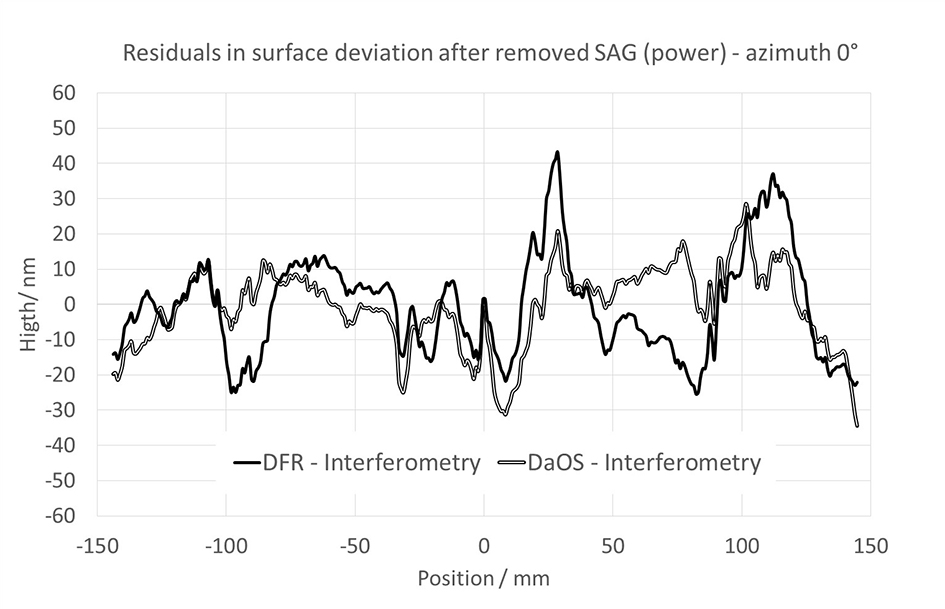
Figure 18: Residuals of DFR- and DaOS- measurements against interferometric results of plan-double sombrero at azimuth 0°.
There are some effects in the results in figure 18 visible, e.g. the large “peaks” at position 30 mm. A better adjustment of centration or an intelligent transformation of coordinates after measurement and bevor surface reconstruction may help to get better results than IRR < 60 nm according to λ/10 and rmsi < 11 nm according to λ/50 @633 nm even on large optics.
5. Summary/ Outlook
We could show, that it is possible to measure very large radius up to 20 m at large optics with more than 300 mm diameter. The relative accuracy of ΔR < 0,69 % will be reduced in further developments and future tasks.
Considering the sagitta error (SAG) we can see some temperature effects and influences of the quality of V-SPOT sensor calibration. Further on and considering the irregularity of spherical optics, we could show the measurements compared with interferometric stitching results at SSI-A and a 12”-Fizeau Interferometer at Berliner Glas, that it is possible to compensate systematical errors of higher order (nonlinearity and penta prism wavefront error) of the setup of DaOS. Good geometrical adjustments and also centration and compensation of mechanical deviations bevor surface reconstruction may help to get better results than IRR < 60 nm according to λ/10 and rmsi < 11 nm according to λ/50 @633 nm even on large optics.
This will be a good starting position even to have not a precision measurement room but measuring in a manufacturing environment.
6. References
[1] Debler, E.; Zander, K. (1997): Ebenheitsmessung an optischen Planflächen mit Autokollimationsfernrohr und Pentagonprisma. In: Physikalisch-Technische Bundesanstalt Braunschweig (PTB) (Hg.): PTB-Mitteilungen Forschen + Prüfen; 89. Jahrgang, S. 339–349.
[2] Weingaertner, I.; Elster, C. (2004): System of four distance sensors for high- accuracy measurement of topography. In: Precision Engineering 28 (2), S. 164–170.
[3] Lammert, H.; Noll, T.; Schlegel, T.; Siewert, F.; Zeschke, F. (2004): XUV-Optik – Neue unkonventionelle Bestimmung ihrer Flächenformen bei BESSY mit der NOM. In: 105. Jahrestagung der Deutschen Gesellschaft für angewandte Optik (DGaO) (01.-05.06.2004 in Bad Kreuznach).
[4] Hofbauer, E.; Lenz, M. (2004): Vignettierung als physikalisches Messprinzip. In: tm - Technisches Messen 75 (3), S. 153–167.
[5] Hofbauer, E. (2007): Optisches Verfahren zur zweidimensionalen Messung von Winkeln und Winkeländerungen bei großen Messabständen. Dissertation zur Erlangung des akademischen Grades Doktoringenieur (Dr.-Ing.). Technische Universität Ilmenau. Fakultät für Maschinenbau.
[6] Hofbauer, Engelbert; Rascher, Rolf; Stubenrauch, Thomas; Wühr, K.; Friedke, Felix; Pastötter, B. et al. (2014): 3D-optical measurement system using vignetting aperture procedure. In: Proceedings of SPIE 9132. Optical Micro- and Nanometrology V, S. 913206–913214.
[7] Zellner, T. (2005): Programmierung, Simulation und Optimierung des videogestützten optischen Winkelmesssystems ELWIMAT. Diplomarbeit. Hochschule München.

Dr. Engelbert Hofbauer
Engelbert Hofbauer studied Precision Engineering at Hochschule München and graduated as Dipl.-Ing. (FH) in 1985. He received his doctoral degree in Optical Engineering at Technical University of Ilmenau in 2008. From 2009 until 2013 he has held a research professorship at Deggendorf Institut of Technology. In this function, he built up the Laboratory for Metrology of Precision Optics Manufacturing at Technology Campus Teisnach.
Since 2013, he has worked as a researcher and project manager in applied research projects with the industry (WiPoVi, DoSuRe) on interferometric and deflectometric data acquisition in order to measure and reconstruct very large optical surfaces of at least plane, spherical, aspherical and also freeforms. In parallel, he directs the company Hofbauer Optik in Munich, which develops and manufactures autocollimation sensors and electronic sighting telescopes for precision metrology in engineering and for the optical industry (e.g. centration for spheres and aspheres).
Dr. Engelbert Hofbauer studierte Feinwerktechnik an der Fachhochschule München und schloss 1985 mit Dipl.-Ing (FH) ab. Er promovierte dann 2008 an der Fakultät Maschinenbau im Fachgebiet Technische Optik/Gerätetechnik an der Technischen Universität Ilmenau. Ab 2009 baute er während einer Professur den Messraum für Fertigungsmesstechnik am Technologie Campus Teisnach der Fachhochschule Deggendorf auf und leitete ihn bis 2013. Seither ist er als wissenschaftlicher Mitarbeiter und Projektleiter in anwendungsnahen Forschungsprojekten mit der Industrie (WiPoVi, DoSuRe) tätig und beschäftigt sich dabei mit interferometrischen und deflektometrischen Messmethoden zur Rekonstruktion großflächiger Optiken, von Planflächen bis Freiformflächen. Parallel dazu leitet er die Fa. Hofbauer Optik Mess-&Prüftechnik in München, welche Autokollimations- und Fluchtmesssensoren für die Präzisionsmesstechnik im Maschinenbau und für die optische Industrie (u.a. Zentriermessung für Sphären und Asphären) entwickelt und fertigt.
Kontakt / Contact:

Prof. Dr.-Ing. Rolf Rascher
Prof. Dr.-Ing. Rolf Rascher ist seit 2001 Professor an der Technischen Hochschule Deggendorf, seit 2012 an der Fakultät Naturwissenschaften und Wirtschaftsingenieurwesen. Schwerpunkte der Lehre sind Fertigungstechnik und Technologiemanagement.
Seit Oktober 2009 leitet er den Technologie Campus Teisnach und die Forschungsgruppe „Optical Engineering“ an der Technischen Hochschule Deggendorf. Daneben betreut er eine Vielzahl von Industrieprojekten aus dem Bereich der Fertigungs- und Messtechnik Optik. Forschungsschwerpunkte sind die Verfahrens- und Prozessentwicklung im Bereich der Optikfertigung und der Bearbeitung sprödharter Materialien.
Prof. Dr.-Ing. Rascher ist Hauptvorsitzender bei der jährlichen SPIE Konferenz „European Seminar on Precision Optics Manufacturing“ am Technologie Campus Teisnach.
Prof. Dr. Rascher has held a professorship at Deggendorf Institute of Technology since 2001. Since 2012, he has been a professor at
the faculty of Natural Sciences and Industrial Engineering. His focus of teaching is in the areas of production technology and technology management.
Since October 2009, he has been head of Technology Campus Teisnach and DIT’s research group „Optical Engineering“. He takes care of a variety of industrial R&D projects in the area of manufacturing and measuring technology for optics. The main focus of his research work is the process development in optics manufacturing and the treatment of hard, brittle materials.
He is first chairman of the annual SPIE conference „European Seminar on Precision Optics Manufacturing“ held at Technology Campus Teisnach.
Kontakt / Contact:

Manon Schilke, B. Eng.
Manon Schilke hat an der Technischen Hochschule Deggendorf (THD) ein Bachelorstudium in Physikalischer Technik mit dem Studienschwerpunkt Sensorische Systeme absolviert. Aktuell ist sie am Technologie Campus Teisnach als technische Mitarbeiterin beschäftigt. Ihr derzeitiges Aufgabengebiet im Bereich der optischen Messtechnik umfasst unter anderem Softwareentwicklung und Datenanalyse.
Manon Schilke has earned a Bachelor’s degree in Applied Physics with a focus on sensor systems at Deggendorf Institute of Technology (DIT). At the moment, she is a technical staff member at Technology Campus Teisnach. Her current area of responsibility in the optical metrology field includes amongst others the development of software and the respective data analyses.
Kontakt / Contact:

Dipl. -Ing. (FH) Johannes Liebl
Johannes Liebl studied Electrical and Information Technology at the Fachhochschule Deggendorf until 2010. As early as during his internships and his diploma thesis he gained considerable experience in the field of optics. Right after completing his studies he started working as a project engineer at Technology Campus Teisnach. The focus of his work lies in optical manufacturing and metrology.
Johannes Liebl hat an der Fachhochschule Deggendorf bis 2010 Elektro- und Informationstechnik studiert. Bereits bei Praktika und in seiner Diplomarbeit konnte er zahlreiche Erfahrungen im Bereich der Optik sammeln. Im direkten Anschluss an sein Studium war er als Projektingenieur am Technologie Campus Teisnach tätig. Die Schwerpunkte seiner Arbeit liegen in der optischen Fertigungs- und Messtechnik.
Kontakt / Contact:

Dr. Jan-Peter Richters
Jan-Peter Richters received his doctoral degree in physics from the University of Bremen in 2010. Since 2012, he has been working in the metrology development department of Berliner Glas on interferometric data acquisition and computer-based data evaluation. His current scope of work lies in the refinement of interferometric measurement capabilities at Berliner Glas.
Dr. Jan-Peter Richters promovierte 2010 im Fachbereich Physik an der Universität Bremen. Seit 2012 arbeitet er in der Abteilung für Messtechnikentwicklung bei Berliner Glas an interferometrischen Messmethoden und rechnergestützter Datenauswertung. Zur Zeit konzentriert er sich auf die Verfeinerung der interferometrischen Messtechniken bei Berliner Glas.
Kontakt / Contact: